I have just been doing (another) reworking on my rendering pipeline. There is an issue I had noticed while profiling the performance for a while but now its become constant and I cant figure out the cause.
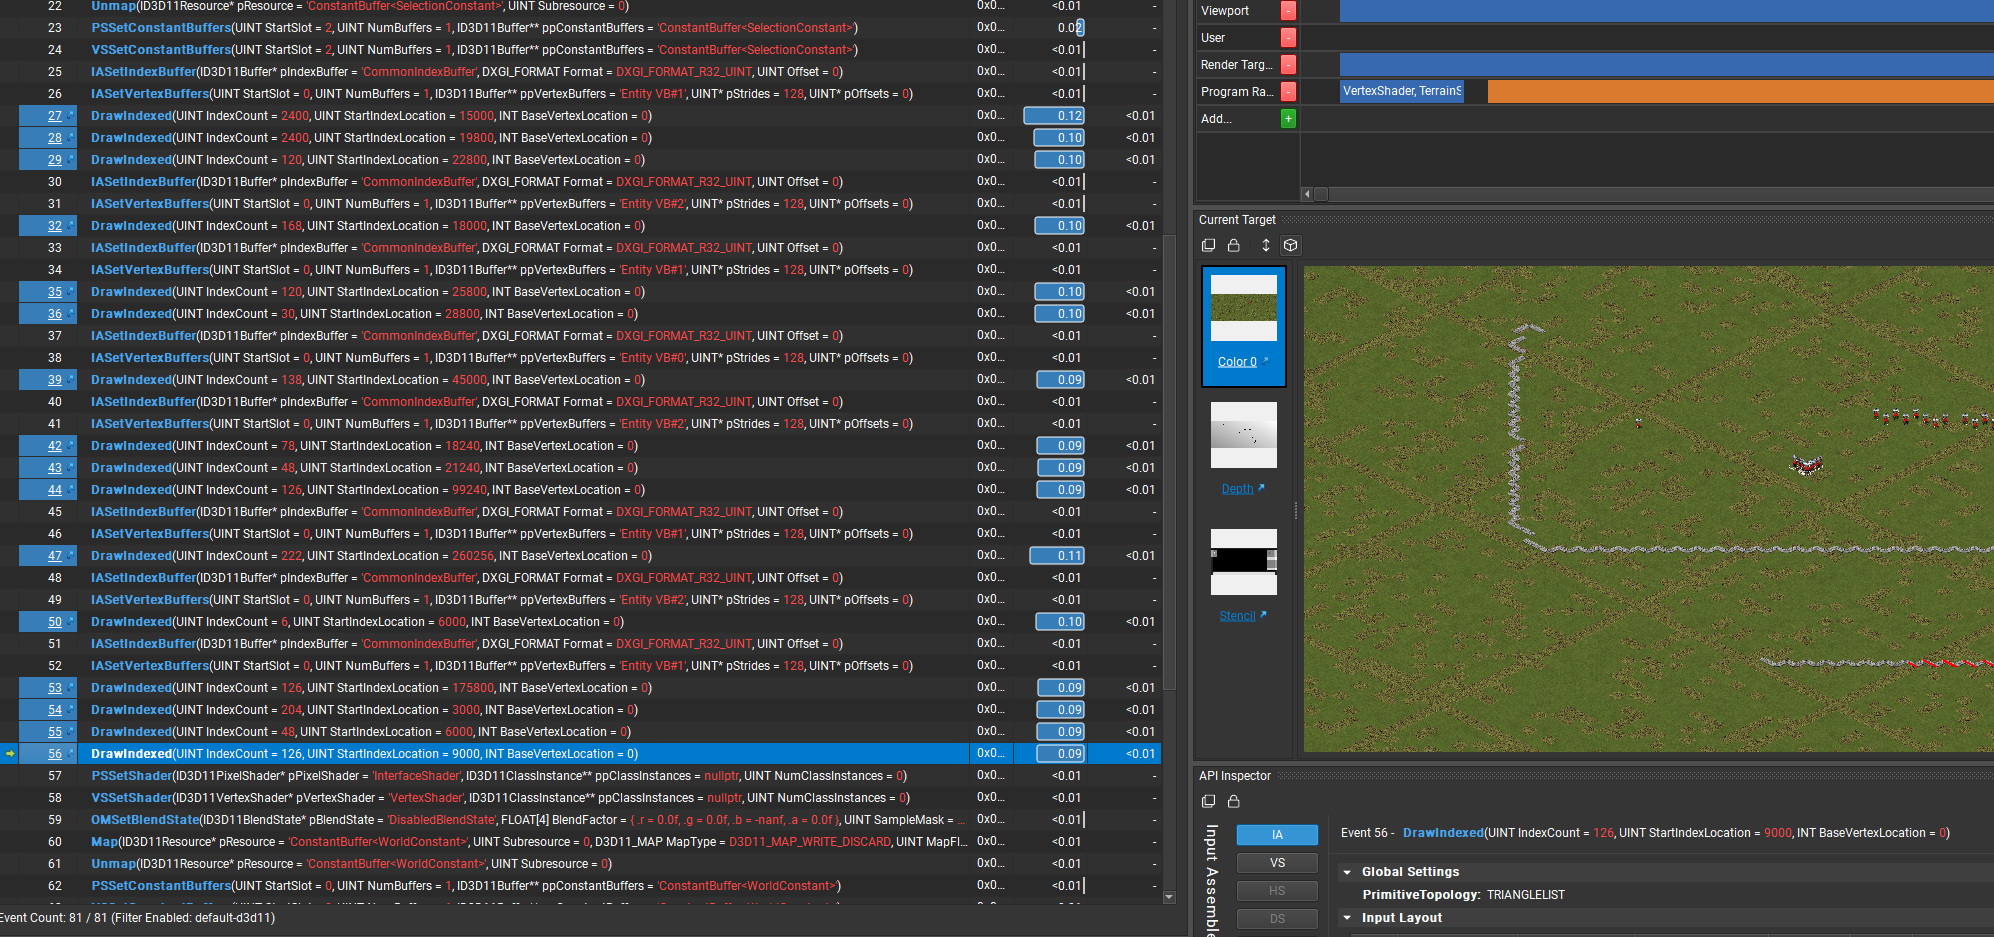
The issue is every call to DrawIndexed is costing 0.1ms - 0.2ms in CPU time. Even when theres no state change to explain it. I can just duplicate the call to DrawIndexed call 5 times in a row in the code (to eliminate the chance something else in the loop is impacting it) and all calls will have the same cost when looking in NVIDIA NSight (see below), I have had frames where I will draw 100 times from the same vertex buffer with different offsets (each being a chunk of the map) and its the same. You can see in this trace there is a few without any state changes showing this behavior.
If I instead render the whole buffer at once the CPU usage is the same but the GPU barely changes, which makes sense, there is so few triangles there's almost nothing to do.
I've tried changing just about everything I can think of to try to tease out what's going on but nothing seems to to impact it.
Any ideas would be greatly appreciated.
I should just mention I am running a pretty high end system 9900k, 3090.