Original Post

As a take-off of my last "Perlin Noise Range" thread, I am trying to calculate various Perlin Noise and value noise distributions. I am asking if someone can please calculate the distribution of these exact noises (as my calculations show very odd distributions): 1) 1985 2D Perlin Noise (as described by Ken Perlin in his 1985 "An Image Synthesizer" paper) 2) 2002 3D Perlin Noise (as described by Ken Perlin in his 2002 "Improving Noise" paper) Here are the distributions I calculated: 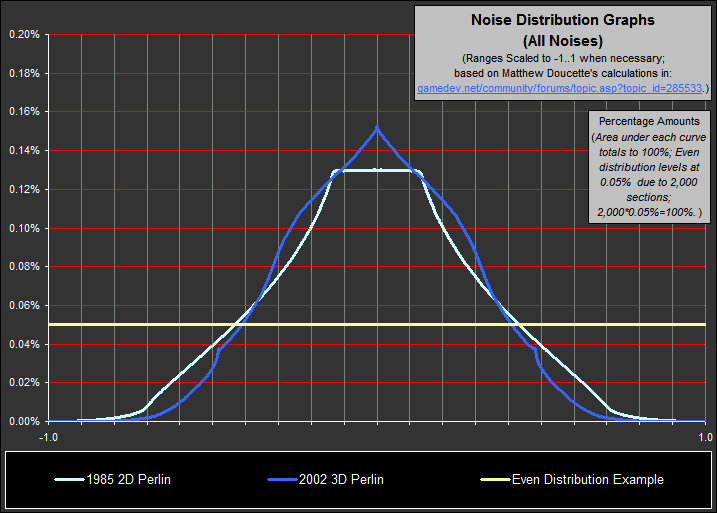 As you can see, they are not what one might expect. Can you perform your own distribution test on those two specific noises and post the results for comparison? Things to watch out for: 1) The noises have been scaled to an absolute range of -1..1, which they are not by default. As far as I have calculated, here are the default ranges: "original" 1985 Perlin Noise range: ----------------------------------- nD: -1/Sqrt(4/n)..1/Sqrt(4/n) (n = noise dimensions) 2D: -0.707106781187..0.707106781187 "improved" 2002 Perlin Noise range: ----------------------------------- 3D: -1.036353811211803..1.036353811211803 (my test program's solution) 2) In the case of 1985 Perlin Noise, use a random set of preset 256 gradient vectors for each sample. Do not calculate your 256 preset gradient vectors and use only those, as you are only calculating the distribution of only that one set. [Edited by - Doucette on January 10, 2005 9:35:01 AM]
As you can see, they are not what one might expect. Can you perform your own distribution test on those two specific noises and post the results for comparison? Things to watch out for: 1) The noises have been scaled to an absolute range of -1..1, which they are not by default. As far as I have calculated, here are the default ranges: "original" 1985 Perlin Noise range: ----------------------------------- nD: -1/Sqrt(4/n)..1/Sqrt(4/n) (n = noise dimensions) 2D: -0.707106781187..0.707106781187 "improved" 2002 Perlin Noise range: ----------------------------------- 3D: -1.036353811211803..1.036353811211803 (my test program's solution) 2) In the case of 1985 Perlin Noise, use a random set of preset 256 gradient vectors for each sample. Do not calculate your 256 preset gradient vectors and use only those, as you are only calculating the distribution of only that one set. [Edited by - Doucette on January 10, 2005 9:35:01 AM]