Hey,
This is a very strange problem... I've got a computation shader that's supposed to fill 3d texture (voxels in metavoxel) with color, based on particles that cover given metavoxel. And this is the code:
static const int VOXEL_WIDTH_IN_METAVOXEL = 32;
static const int VOXEL_SIZE = 1;
static const float VOXEL_HALF_DIAGONAL_LENGTH_SQUARED = (VOXEL_SIZE * VOXEL_SIZE + 2.0f * VOXEL_SIZE * VOXEL_SIZE) / 4.0f;
static const int MAX_PARTICLES_IN_METAVOXEL = 32;

struct Particle
{
	float3 position;
	float radius;
};

cbuffer OccupiedMetavData : register(b6)
{
	float3 occupiedMetavWorldPos;
	int numberOfParticles;
	Particle particlesBin[MAX_PARTICLES_IN_METAVOXEL];
};

RWTexture3D<float4> metavoxelTexUav : register(u5);

[numthreads(VOXEL_WIDTH_IN_METAVOXEL, VOXEL_WIDTH_IN_METAVOXEL, 1)]
void main(uint2 groupThreadId : SV_GroupThreadID)
{
	float4 voxelColumnData[VOXEL_WIDTH_IN_METAVOXEL];

	float particleRadiusSquared;
	float3 distVec;

	for (int i = 0; i < VOXEL_WIDTH_IN_METAVOXEL; i++)
		voxelColumnData[i] = float4(0.0f, 0.0f, 1.0f, 0.0f);

	for (int k = 0; k < numberOfParticles; k++)
	{
		particleRadiusSquared = particlesBin[k].radius * particlesBin[k].radius + VOXEL_HALF_DIAGONAL_LENGTH_SQUARED;

		distVec.xy = (occupiedMetavWorldPos.xy + groupThreadId * VOXEL_SIZE) - particlesBin[k].position.xy;

		for (int i = 0; i < VOXEL_WIDTH_IN_METAVOXEL; i++)
		{
			distVec.z = (occupiedMetavWorldPos.z + i * VOXEL_SIZE) - particlesBin[k].position.z;

			if (dot(distVec, distVec) < particleRadiusSquared)
			{
				//given voxel is covered by particle
				voxelColumnData[i] += float4(0.0f, 1.0f, 0.0f, 1.0f);
			}
		}
	}

	for (int i = 0; i < VOXEL_WIDTH_IN_METAVOXEL; i++)
		metavoxelTexUav[uint3(groupThreadId.x, groupThreadId.y, i)] = clamp(voxelColumnData[i], 0.0, 1.0);
}
And it works well in debug mode. This is the correct looking result obtained after raymarching one metavoxel from camera:
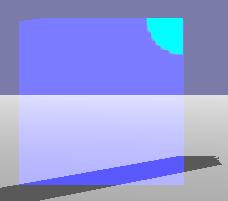
As you can see, the particle only covers the top right corner of the metavoxel.
However, in release mode The result obtained looks like this:
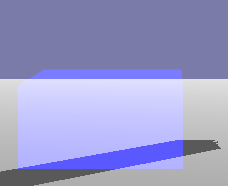
This looks like the upper half of the metavoxel was not filled at all even with the ambient blue-ish color in the first "for" loop... I nailed it down towards one line of code in the above shader. When I replace "numberOfParticles" in the "for" loop with constant value such as 1 (which is uploaded to GPU anyway) the result finally looks the same as in debug mode.
This is the shader compile method from Hieroglyph Rendering Engine (awesome engine) and it looks fine for me but maybe something's wrong? My only modification was adding include functionality
ID3DBlob* ShaderFactoryDX11::GenerateShader( ShaderType type, std::wstring& filename, std::wstring& function,
std::wstring& model, const D3D_SHADER_MACRO* pDefines, bool enablelogging )
{
HRESULT hr = S_OK;
std::wstringstream message;
ID3DBlob* pCompiledShader = nullptr;
ID3DBlob* pErrorMessages = nullptr;
char AsciiFunction[1024];
char AsciiModel[1024];
WideCharToMultiByte(CP_ACP, 0, function.c_str(), -1, AsciiFunction, 1024, NULL, NULL);
WideCharToMultiByte(CP_ACP, 0, model.c_str(), -1, AsciiModel, 1024, NULL, NULL);
// TODO: The compilation of shaders has to skip the warnings as errors
// for the moment, since the new FXC.exe compiler in VS2012 is
// apparently more strict than before.
UINT flags = D3DCOMPILE_PACK_MATRIX_ROW_MAJOR;
#ifdef _DEBUG
flags |= D3DCOMPILE_DEBUG | D3DCOMPILE_SKIP_OPTIMIZATION; // | D3DCOMPILE_WARNINGS_ARE_ERRORS;
#endif
// Get the current path to the shader folders, and add the filename to it.
FileSystem fs;
std::wstring filepath = fs.GetShaderFolder() + filename;
// Load the file into memory
FileLoader SourceFile;
if ( !SourceFile.Open( filepath ) ) {
message << "Unable to load shader from file: " << filepath;
EventManager::Get()->ProcessEvent( EvtErrorMessagePtr( new EvtErrorMessage( message.str() ) ) );
return( nullptr );
}
LPCSTR s;
if ( FAILED( hr = D3DCompile(
SourceFile.GetDataPtr(),
SourceFile.GetDataSize(),
GlyphString::wstringToString(filepath).c_str(), //!!!! - this must be pointing to a concrete shader file!!! - only directory would work as well but in that case graphics debugger crashes when debugging shaders
pDefines,
D3D_COMPILE_STANDARD_FILE_INCLUDE,
AsciiFunction,
AsciiModel,
flags,
0,
&pCompiledShader,
&pErrorMessages ) ) )
//if ( FAILED( hr = D3DX11CompileFromFile(
// filename.c_str(),
// pDefines,
// 0,
// AsciiFunction,
// AsciiModel,
// flags,
// 0,//UINT Flags2,
// 0,
// &pCompiledShader,
// &pErrorMessages,
// &hr
// ) ) )
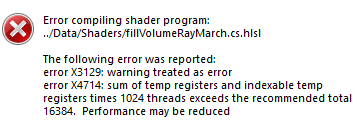
{
message << L"Error compiling shader program: " << filepath << std::endl << std::endl;
message << L"The following error was reported:" << std::endl;
if ( ( enablelogging ) && ( pErrorMessages != nullptr ) )
{
LPVOID pCompileErrors = pErrorMessages->GetBufferPointer();
const char* pMessage = (const char*)pCompileErrors;
message << GlyphString::ToUnicode( std::string( pMessage ) );
Log::Get().Write( message.str() );
}
EventManager::Get()->ProcessEvent( EvtErrorMessagePtr( new EvtErrorMessage( message.str() ) ) );
SAFE_RELEASE( pCompiledShader );
SAFE_RELEASE( pErrorMessages );
return( nullptr );
}
SAFE_RELEASE( pErrorMessages );
return( pCompiledShader );
}Could the shader crash for some reason in mid way through execution? The question also is what could compiler possibly do to the shader code in release mode that suddenly "numberOfParticles" becomes invalid and how to fix this issue? Or maybe it's even sth deeper which results in numberOfParticles being invalid? I checked my constant buffer values with Graphics debugger in debug and release modes and both had correct value for numberOfParticles set to 1...