Embedding comments in machine-code/JIT

Started by
20 comments, last by Juliean 1 month, 3 weeks ago

Hello,

I've started working on a simple JIT-compiler for my bytecode-based script-interpreter, which involves hand-crafting machine-code into an executable code-page and the running as a function-pointer.

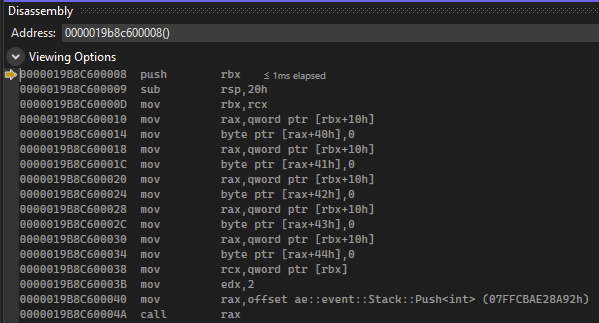
Now I've been wondering, is there any way to embedd comments into this machine-code? For reference, Visual Studio allows me to debug the machine-code I created view their disassembly-view:

But this is obviously getting a bit hard to read without any structure to it. I know that you can add comments to ASM:

mov rbx,rcx // store "state" function argument to be reused later 

Yet I havn't found any information about how this translates to machine-code. I recon that normally you wouldn't want comments in machine-code, so I guess there is no normal way to do this? I'd still like to take a shot by asking. And if there is no default way, does somebody maybe know if there's a way to supply visual studio with information on how to match custom code with their Disassembly-View? They are able to link LoC in the normal source with this view, but this is probably based on the debug-information available for the executable.

Advertisement

No, not in that view.

Disassembly is the compiled results.

A common analogy is that you can make hamburger out of cow, but you can't turn a hamburger back into a cow. The original source code is lost.

If you're viewing it in Visual Studio and have access to the original source, you can right click to turn on various options, or use the “viewing options” drop-down in some versions of VS. You can show the byte code, show the symbol names, and show the source code that corresponds to the code.

For example:

The yellow stuff is the C++ source code, optionally showing the line numbers.

The red areas show the raw bytes that you find in the executable. The human readable interpretation of those bytes is on the right.

The addresses in memory where the executable happens to be located in the debugger are on the left. The address is randomly different every time the program is run, unless it was launched in a debugger then the system can try to load it at the same location each time.

If you're writing code in assembly, you can add comments to the code all you want. When it gets compiled, assembled, and linked into the executable all those comments will be stripped out.

The usual approach is as far as I know to create another file that relates data in the machine language file back to pieces of original source code, something along the lines of “17 bytes at offset 54346 relate to line 121 of file x.cpp”. You may want to check the output format of a compiler for inspiration, eg the ELF format at a Linux system. Didn't verify it, but I would expect that debugging data gets stored there.

If you have your own bytecode, and you want that info directly in the machine code, nothing stops you from adding a “CMT” comment operation that takes a string as parameter (ie the comment you want to store). It can act as a “nop” (ie does nothing). Alternatively, you can have a similar “SRC” operation that states the original source lines (that is, saying “line 121 of file x.cpp starts here”), or even the actual source code as string.

Obviously, running byte code with all these CMT or SRC nop operations is going to be somewhat less fast, and take more space.

frob said:
If you're viewing it in Visual Studio and have access to the original source, you can right click to turn on various options, or use the “viewing options” drop-down in some versions of VS. You can show the byte code, show the symbol names, and show the source code that corresponds to the code.

The thing I'm lost at is, how am I supplying the information for mapping my own bytecode back to the machine-code address so that VS can see it? I know it does what you show for native code, and probably even for C# or something, but since this is all my own language, do I need to create a certain file and/or call an API to tell the debugger “address 0x325267f from this JIT-compile code maps back to text-line “jmp .LABEL” from my bytecode"?

frob said:
A common analogy is that you can make hamburger out of cow, but you can't turn a hamburger back into a cow. The original source code is lost.

Its doing it so a certain extend though, by converting machine-code back to ASM, no? At least I'm not creating any ASM but only the binary machine-code, yet I'm still seeing the human-readable ASM, thats only why I even came to the idea, but I suppose it makes sense that there is no way to add comments to machine-code since with all the tooling usually available, it wouldn't make sense.

Alberth said:
If you have your own bytecode, and you want that info directly in the machine code, nothing stops you from adding a “CMT” comment operation that takes a string as parameter (ie the comment you want to store). It can act as a “nop” (ie does nothing). Alternatively, you can have a similar “SRC” operation that states the original source lines (that is, saying “line 121 of file x.cpp starts here”), or even the actual source code as string. Obviously, running byte code with all these CMT or SRC nop operations is going to be somewhat less fast, and take more space.

Ah sorry, I'm not talking about adding comments to the bytecode, but the JIT-compiled machine-code. The bytecode is fine without comments, I have a view where I can hover over the lines to highlight the source-mapping, similar to what godbolt does, in my own editor. And I could add comments without any runtime-overhead in my internal representation of the bytecode-instructions if I needed. Its only the newly created machine-code that I have to view in the Visual Studio Debugger that is the problem.

Juliean said:
Its only the newly created machine-code that I have to view in the Visual Studio Debugger that is the problem.

Ah right, I have no Visual Studio, so I don't know how generic the debugger is. Assuming you can teach it a new language in some way, there may be an API to supply a source code mapping so it can pull text from a source file to display next to the de-coded machine code?

You may want to ask this at some Visual Studio forum though, there are likely more people there with this kind of knowledge.

Juliean said:
I know it does what you show for native code, and probably even for C# or something, but since this is all my own language, do I need to create a certain file and/or call an API to tell the debugger “address 0x325267f from this JIT-compile code maps back to text-line “jmp .LABEL” from my bytecode

The disassembly view is merely showing opcodes in a more human-friendly format. Nothing more.

If the debugger symbols tell it where they line up it can show them. If this is for your own unique language that is generating executable code, you'll need to generate a pdb file that includes the mapping.

Juliean said:
Its doing it so a certain extend though, by converting machine-code back to ASM, no? At least I'm not creating any ASM but only the binary machine-code, yet I'm still seeing the human-readable ASM, thats only why I even came to the idea, but I suppose it makes sense that there is no way to add comments to machine-code since with all the tooling usually available, it wouldn't make sense.

Correct. It can show you both the machine code (the red area in my image) and also the human-readable format in assembly language. It is a view-only version of the executable file, not the source code. VS can display the source code if mapping data and the source file are both available, otherwise it can only show the disassembly view.

If you want to generate all that information, it is possible and not much more work than writing a compiler in the first place. The PDB, or program database, has all the information the debugger needs. They're quite open about the data file format, it is straightforward if you need to read or write your own.

frob said:
If you want to generate all that information, it is possible and not much more work than writing a compiler in the first place. The PDB, or program database, has all the information the debugger needs. They're quite open about the data file format, it is straightforward if you need to read or write your own.

Ok, after digging into PDB a bit deeper, I don't think that would really work in my case, as it seems that the PDB needs a matching PE/COFF-executable (and not just a blob of instructions like I'm generation), as by https://llvm.org/docs/PDB/PdbStream.html:

The executable is a PE/COFF file, and part of a PE/COFF file is the presence of number of “directories”. For our purposes here, we are interested in the “debug directory”. The exact format of a debug directory is described by the IMAGE_DEBUG_DIRECTORY structure. For this particular case, the linker emits a debug directory of type IMAGE_DEBUG_TYPE_CODEVIEW. The format of this record is defined in llvm/DebugInfo/CodeView/CVDebugRecord.h, but it suffices to say here only that it includes the same Guid and Age fields. At runtime, a debugger or tool can scan the COFF executable image for the presence of a debug directory of the correct type and verify that the Guid and Age match.

On the contrary, I did find some API-functions for supplying symbols to the debugger ad runtime, via SymLoadModuleExW/SymAddSymbolW in DbgHelp.h:

const auto process = GetCurrentProcess();
static bool hasInitialized = false;
if (!hasInitialized)
{
	if (!SymInitialize(process, nullptr, false))
		Log::OutErrorFmt("Failed to call SymInitialize.");

	hasInitialized = true;
}

//if (!SymLoadModuleExW(process, nullptr, L"Test.dll", nullptr, (DWORD64)(pMemory + 8), DWORD(codeSize), nullptr, SLMFLAG_VIRTUAL))
//	Log::OutErrorFmt("Failed to call SymLoadModuleEx.");

uint32_t index = 0;
for (const auto [target, bytecode, info] : data.vBytecodeMapping)
{
	const auto end = [&]() -> uint32_t
	{
		const auto next = index + 1;
		if (data.vBytecodeMapping.IsValidIndex(next)) [[likely]]
			return data.vBytecodeMapping.At(next).target - REFERENCE_SIZE;
		else
			return uint32_t(codeSize);
	}();

	const auto code = DWORD64(pMemory + target);
	const auto size = end - target;
	if (!SymLoadModuleExW(process, nullptr, nullptr, nullptr, code, size, nullptr, SLMFLAG_VIRTUAL))
		Log::OutErrorFmt("Failed to call SymLoadModuleEx.");
	if (!SymAddSymbolW(process, code, L"Test(void)", code, size, 0))
		Log::OutErrorFmt("Failed to call SymAddSymbol.");

	index++;
}

This seems to work in supplying a name to the function, but its critically lacking the ability to specify the line/source-file mapping which is being enumerated by SymGetLineFromXXX-functions as well as from the debugger itself. But SymAddSymbol seems to be the only way to “add” anything to the virtual module. Am I missing something, or do I really have to create a PE/COFF-formatted executable alongside a full PDB in order for this symbols to work?
Juliean said:
Am I missing something, or do I really have to create a PE/COFF-formatted executable alongside a full PDB in order for this symbols to work?

The executable better be PE format since you're on Windows and that's what executables are.

If the goal is to use Visual Studio's integrated debugger, Visual Studio relies on data in the PDB file. To get VS to automatically map your source code line to the disassembly view you'll need all the module information (which is what maps a range of executable bytes to a collection of lines) and the file information (which maps from module to source file). I don't know what more you may need to include and what else is optional.

frob said:
The executable better be PE format since you're on Windows and that's what executables are.

But I'm not really creating an executable - everything I've been able to read about JIT-compilers is that they work similar to what I'm doing:

auto* pMemory = VirtualAlloc(nullptr, codeSize, MEM_COMMIT | MEM_RESERVE | MEM_TOP_DOWN, PAGE_READWRITE);

// write code here

VirtualProtect(pMemory, codeSize, PAGE_EXECUTE_READ, PAGE_READWRITE);

using JitFunction = void(*)(const ExecutionState&);

return (JitFunction)pMemory;

This part confuses me a bit, does that now mean that in order to get debuggability I'm forced to create a full windows-compatible-DLL? That would be a bit too much for what I'm trying to achieve, in that case I'll just skip on that part I think. I should be able to add a custom hook into the stackwalk using the Sym-API. Kind of weird that there is no equivalent for programmatically add line mapping, as there is actually a working variant for exception-handling (RtlAddFunctionTable) which you can use for JIT-code without having the OS finding a pdata/xdata-section via the executable-format.

The PE (Portable Executable) format is used for both the exe and dll files. You can call LoadLibrary on an exe just as well as a dll.

JIT compilation is basically exactly what you described. The thing gets compiled, loaded into the process space (which triggers effects like virus scans) and then the functions can be executed. Normally there are protections against executing code kept in data, but loading it this way allows for security steps to happen first.

If you want Visual Studio to be able to map the disassembled view to a source file, you will need to provide the mapping, yes.

This topic is closed to new replies.

Advertisement