What kind of coding standard do you prefer

Started by
82 comments, last by JoeJ 1 year, 4 months ago

Juliean said:
If you ever end up having time to revisit this again, I'd be interested in one last thing. If you removed the “list” linking inside the objects themself and place them in a separate structure (to simulate the example that I mentioned where you can't store such a link in the objects themselves), how much does that affect performance for the list-case? No hurry, just something I'm curious about.

Pretty sure no difference would show. I try such things here and there, but mostly it does not matter. Probably because CPUs have multiple ‘cache streams’, or how's that called. The objects and the links would have the same access pattern, so ther should be little effect. But yeah, would be interesting to try.

More interesting it would be to reorder the objects. After the lists are build, we would iterate grid cells, traverse the list of the cell and copy the particle in this order to a new, nicely sorted vector. So we have just one random access per object.
The list is no longer needed, just a begin and end index of objects per cell.
For the collision detection, we now iterate over sequential memory per cell, so this should make it noticeable faster.

But i doubt it's a win here. The bandwidth cost of reordering is worst case. So this adds a system wide bottleneck, if you do some multi threading.
And even worse: Such optimization is only worth it if we have many objects per cell, so the sorted sequences have some length to show a net benefit.
For particle fluid simulations (or my dense example with high object count) that's worth it, but for game objects likely not. On average you will have less than one object per cell, making such ideas pointless.

In my experience there is always very little benefit from optimizing for memory access patterns, if we compare against optimizing to reduce work.

I also ended up creating an array<vector>

This would be actually interesting to compare with the alternative, after i saw nested vectors don't do that bad.
The alternative, which i call binning, is to loop over the objects two times. First, we sum up the count which goes into each bin. We also store the current count for each object.
Then we do a prefix sum over the bin counts, which gives us begin and end for each bins list in one compacted array which has the same size as the objects.
Second, we iterate over objects again, adding their local count to the bucket begin and place the objects at this index.

The BVH build is an actual example of this. It does just that to reorder objects from parent bins to new child bins as we add a tree level, similar to how some in place sorting algorithm works.
The advantage is it works with constant memory and avoids any allocations, and the time complexity is still O(1) per object, plus O(N) where N is the bin count. It's also parallelizable easily, and works well on GPU, where the bin cost reduces to O(log n).

This binning became a nice building block for me, which i use really often. Way more often than sorting. It's faster and often good enough for the same purpose.
And it did beat nested vectors in any case, whenever i've tried to compare. But that was some years ago, on my old computer, with older compilers and libraries. So no longer sure. Likely it ‘depends’.

Juliean said:
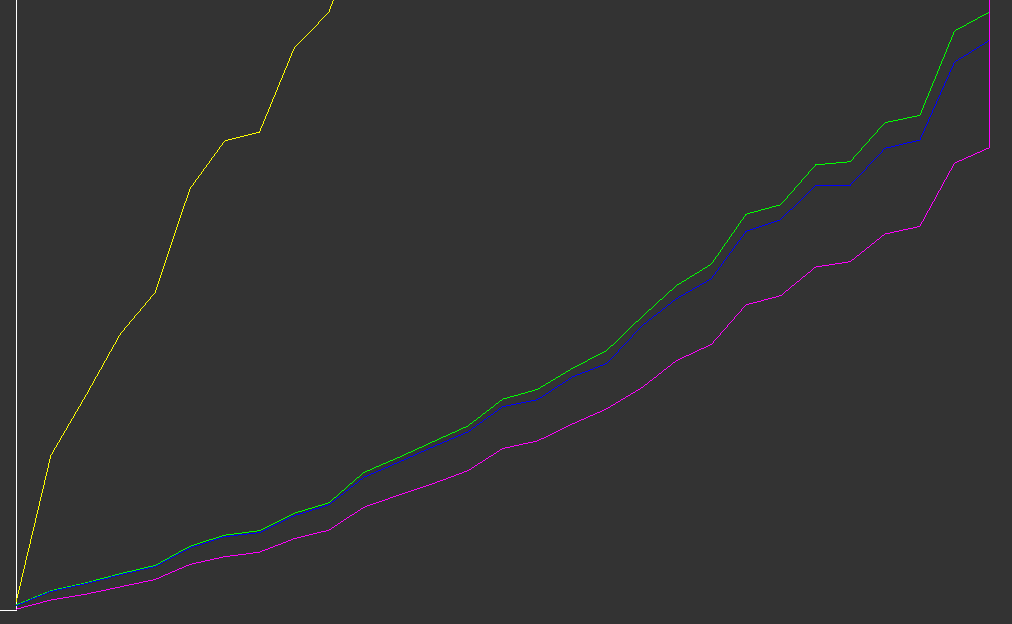
Debug-performance for running the tests did improve to something like 70x→75x

You know… somebody needs to tell you this, ahem…
‘Using debug mode for profiling is pointless, even more so if you use stl.’
But i guess you knew that already : )

If i could run my editor in debug, that would be very nice, really.
But actually it takes minutes just o load a fricking mesh. Even filling a std::vector<bool> with zeroes takes 2 minutes, the fuck! And no, i won't do my own bool vector. Too lazy.

So when the hell do they finally intend to fix this? How many billions per year are lost world wisde, just because Microsofts STL sucks in debug mode (at least)?

And while i'm at it, that's not the worst thing. I mean, idon't absolutely need a debugger. I can guess, and log…
No. The worst thing is this:

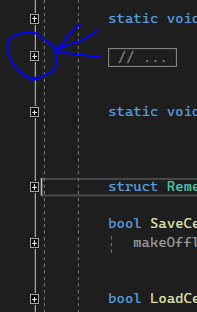
This is how a proper h file has to look like. (If it's 30k lines of code, um)
I have to collapse all those little bastards, except one, or two.

So i go through all those 30k lines, and click to make each - a nice, collapsed +

Then i type a letter. You know, coding.

But then: Damn shitty VS uncollapses all those + again! At least dozens of them. I do not even see the place where my cursor is. I see some random, unrelated other function i don't want to see.

So i go through all those 30k lines again, and click to make each - a nice, collapsed +

Then i type a letter. You know, coding. But more angry this time.

But then - again the same, infinite loop of clicking all those little - bastards……

I do this all day long. Every day. Since many, many years.

This, and only this is the biggest problem with programming. Coding style doesn't matter. Bjarnes new book doesn't help. And they will never ever fix this bug, nor will they provide a useful way to auto collapse h files.

ahh, sigh, i feel better now. I never told this anybody before. Maybe there is some plug in? If anybody knows - help me! \>:o/

Advertisement

OH GREAT, lost another post to this stupid forums editor (the editor is stupid, not the forum. But I'm mad).

JoeJ said:
Pretty sure no difference would show. I try such things here and there, but mostly it does not matter. Probably because CPUs have multiple ‘cache streams’, or how's that called. The objects and the links would have the same access pattern, so ther should be little effect. But yeah, would be interesting to try.

It should have a difference - of course as we “learned", you never really know until measure ? Thats why I did do some own tests regarding std::list vs vector, just to make sure I'm not imagining things. And yeah, at least thats still as bad as I remember:

https://pastebin.com/NZJ2yR6Y

So thats more of a synthetic benchmark, but since we talk about what CPUs can or can't mask… Essentially I create eigther a vector or list with the same properties. I add 10000000 elements with a chance of 1/1000 to be “included”. Seed is fixed for both cases. Then I perform a linear search through the containers for the first “included” element. I essentially do nothing with it (there is a function that “consumes” the value as cheaply as possible just so it doesn't get optimized out entirely), but I do mark it not “included” anymore and restart the search, 5000 times. This should show the overhead of creation of a dynamic list-like structure (which is what I sort of expect to have to be done if you want to have the same structure but just in an external container. Now for the results (release this time ?)


[19.12.2022 16:45:35-763] CORE Info: Vector-creation took 0.075228s
[19.12.2022 16:45:40-109] CORE Info: Vector-search took 4.346626s
[19.12.2022 16:45:40-396] CORE Info: List-creation took 0.284418s
[19.12.2022 16:46:33-485] CORE Info: List-search took 53.088795s

Interestingly, the creation of a list is not as expensive as I imagined, even though I fully reserve the vector and even use the more optimized “EmplaceBackReserved”. Its still almost 4 times as slow, which is something. But the iteration-speed…

I mean, we could probably argue for a few more pages about whether or not that algorithm makes any sense :P But it does show that caching itself, for that type of structure, does not fully cover the cost of such indirect structures, because just by cache alone, traversing the list over and over should mean that more and more of it should be in cache (my CPU has a fuckton of cache-space). Ok, I cannot fully rule out that std::list is just horribly written, maybe just in MSVC, and running that exact code in other compilers wouldn't be so easy without some modifications that I don't feel like doing right now. But it kind of confirms what I've know so far, unlike your results.

Which kind of leads me to belive that what makes your example so much faster, might be the fact that the next-pointer is stored in the object. This means that both execution and iteration is tied to the same value being loaded from memory. So in the vector, you have the stream of stored objects to be loaded, and in the list-case you only have the objects. Sure, you also have separate vectors for each cell which my example doesn't, and building does take longer, but even just the raw iteration-speed in your case is only like 30-50% slower, unlike the >1000% in my example.

I did not plot out too many results for different settings, but at least even if I always search the same range (without setting included=false), it relatively performs the same, with the list still iterating 10x slower than vector.

So it would be interesting to me to really see what exactly is causing such a difference in your example. Maybe I'll do some further tests to recreate the kind of structure you have, to see how that fares in such an example as mine.

JoeJ said:
You know… somebody needs to tell you this, ahem… ‘Using debug mode for profiling is pointless, even more so if you use stl.’ But i guess you knew that already : )

Soo since I lost my long reply - you mean that only half-serious, right? Please, I don't want to have to type out why I think debug performance/profiling is actually important if you want to develop efficently :D I'm just going to say that, yeah, as you say, it is extremely handy just being able to always stay in debug, with an editor that runs in debug as fast as that other shitty game-engine would normally (you know which one I mean ?). And also, MSVC agrees with me:

- std::move, std::forward, std::move_if_noexcept, and std::forward_like will now not produce function calls in generated code, even in debug mode. This is to avoid named casts causing unneccesary overhead in debug builds. /permissive- or a flag which implies it (e.g. /std:c++20 or std:c++latest) is required.
- Added [[msvc::intrinsic]] to support the above item. This can be applied to non-recursive functions consisting of a single cast, which take only one parameter.

Their longer explanation, for which I cannot find the link, is that “debug performance is important, especially for game-developers”. At least also in their eyes ?

Juliean said:
So it would be interesting to me to really see what exactly is causing such a difference in your example. Maybe I'll do some further tests to recreate the kind of structure you have, to see how that fares in such an example as mine.

Oh, I do think I figured it out: https://pastebin.com/K5fkbxb2

This code includes two different ways of representing your list that is stored inside the objects. So running it with 200.000 objects (I don't have all day waiting for slow lists to complete ?):

[19.12.2022 17:25:10-361] CORE Info: Vector-creation took 0.00286s
[19.12.2022 17:25:10-553] CORE Info: Vector-search took 0.191071s
[19.12.2022 17:25:10-559] CORE Info: List-creation took 0.005903s
[19.12.2022 17:25:12-805] CORE Info: List-search took 2.24626s
[19.12.2022 17:25:12-815] CORE Info: Implicit list-creation took 0.000388s
[19.12.2022 17:25:15-266] CORE Info: Implicit list-search took 2.450818s
[19.12.2022 17:25:15-271] CORE Info: Implicit inline list-creation took 0.000183s
[19.12.2022 17:25:16-217] CORE Info: Implicit inline list-search took 0.945242s

Interesting. The implicit list, where all objects are stored as pointers, is slightly slower than std::list. The variant where simply objects are stored inline in one vector, performs way faster than list (but still, slower than vector). Thats probably the highest actual improvement I've ever seen from actually just storing objects inside one vector (if not iterating over the same vector).

But, now to probably explain whats going on in your example, lets look at some way smaller numbers (num=100):

[19.12.2022 17:28:22-700] CORE Info: Vector-creation took 0.000014s
[19.12.2022 17:28:22-701] CORE Info: Vector-search took 0.000301s
[19.12.2022 17:28:22-701] CORE Info: List-creation took 0.000006s
[19.12.2022 17:28:22-701] CORE Info: List-search took 0.000492s
[19.12.2022 17:28:22-701] CORE Info: Implicit list-creation took 0.000001s
[19.12.2022 17:28:22-702] CORE Info: Implicit list-search took 0.00049s
[19.12.2022 17:28:22-702] CORE Info: Implicit inline list-creation took 0.000001s
[19.12.2022 17:28:22-702] CORE Info: Implicit inline list-search took 0.000483s

See, now we are getting somewhere. This is about the same difference in performance in your results, for iteration. So that kindof explains it. If the number of elements inside the “container” itself is small enough, the difference is not as apparent. Not that it does increase really fast - I don't have the ways right now to easily scale/plot this, but at num==200 already starts to be 3-4x slower. That isn't really good in a the sense of O-complexity though, is it? The idea is that you can add stuff and it will scale a certain way. So if you have a container that works well with <100 elements, but really loses after that… know what that reminds me of? ? To be fair, if the algorithm can alway guarantee that those individual container stay that size, its ok.

So then I presume that your example seems to fall into that place, where the elements inside each individual container are very few, and thus iteration-overhead is low. I would not have assumed that TBH. Its still slower then vector, but now if you do have to build all the different vectors for cells it makes sense that it pays off. Hm. Still makes me wonder about different solutions that link the objects together, but don't require linking via list. What you suggested with sorting, I agree, might not be the best. I'm still kind of wondering about solutions where you sacrifice a ton of memory to be able to allocate most cells inline without having to move anything. Might even combine that with VirtualAllocing a certain address range (not physical memory), and if you ever run out on the memory you commited, you just commit more (that way you could have a very large memory-area without taking too much more physical memory than you need). buuut… I guess that would be way to complicated to put together for a smaller example, well :D

@joej Oh yeah, thats one thing that the editor lost for me -.-

If you have trouble with debug-performance for STL-containers, try defining

_ITERATOR_DEBUG_LEVEL=0

This will remove much of the overhead you have with them. A carefully constexpr-aware/extended custom implementation of course will still be better, but thats already waaay faster. I don't have my own unordered_map (well only one that is optimized for 10-50 elements), but even those are acceptable with that settings.

Only downside? I think every library you link needs to have the same defines, at least if it uses STL. Also you lose some of the debug-ability you get from the things iterator-debugging does, but honestly, I never really missed it. Everything it catches can usually be caught with AppVerifier if you really every really run over invalidated iterators or such things.

Juliean said:
OH GREAT, lost another post to this stupid forums editor (the editor is stupid, not the forum. But I'm mad).

not as bad as -+-+-+-+-+-+ all the life :D

Juliean said:
It should have a difference - of course as we “learned", you never really know until measure

Nah. I have learned nothing.
First i thought i would have learned.
But then it was due to a bug, so i had to unlearn.
And then the results were exactly as expected and boring.

Next time i feel like having surprising performance results, i'll look for a bag sooner. That's something, at least \:D/

(Oh - i already forgot about the nested vectors it seems.)

Juliean said:
Ok, I cannot fully rule out that std::list is just horribly written

I don't wanna rant even more, but i was puzzled too why lists are so terrible slow to traverse. And i followed the same thoughts, thinking about cache misses. But that's just guessing. We come up with some educated guess to explain the unknown well enough.
That's fine, but it does not work to learn about performance. For that we need to know all involved code in detail. Otherwise we make again just conclusions about the unknown. Even knowing the C++ code, it's still guessing on the machine instructions.
Applies to me at least. I only see STL code if a crash pops up the file. And i never check compiled instructions at all.
Might be interesting to log the memory addresses of the elements, to see how much jumping there really is.
And such synthetic benchmarking, isolating iteration cost as much as possible, kinda misses to point one could argue. I mean, nobody would make list with 10M elements, if we have to assume each element is it's own allocation. The overhead for the memory management is larger than the element size in your test.

Personally i try to make sense out of performance in a very different way: In cases where i try multiple options, i remember which did better, and then i prefer it in the future. Ideally i try to back my results with understanding the HW, but this rarely really works.
And as soon as STL is involved, nothing works at all for me. The things i believed to have learned yesterday, turn out to be the other way around tomorrow. Just because the application is a bit different.
STL remains mainly a tool for producibility and convenience to me. I need it to get things done. But if performance really matters, i'll try to make sure it's unknowns have no effect.

Juliean said:
maybe just in MSVC, and running that exact code in other compilers

Switching to Clang is easy now and low effort. I feel it's also especially stronger with modern language features like lambdas and templates.
But you will still use Microsofts STL implementation. So if that's bad, it remains bad. Depends on compiler still ofc., but idk if we have a practical opportunity to try alternatives, running Windows.
I did not search for related comparisons on the web either. Overall i'm happy, beside the debug perf.
I wonder if EAs partial port of STL for games is till widely used. And why, if so.

Juliean said:
but even just the raw iteration-speed in your case is only like 30-50% slower, unlike the >1000% in my example.

Why do you assume 30-50%? If this were the case, the vectors of copies would win over the list, but they don't?
As said before, i use a linked list, actually just a pointer. Basically i do pointer chasing.
STLs list container is way more than that. It manages the allocation of individual objects as well, with some unknown implementation.
It's clear that teh unknown here outweights the trivial use of a pointer, so we can't compare this in a sense of expected performance.
Also, i am pretty sure that i f would put the pointers in it's own array, or if i would replace pointers with indices, the performance would remain the same.

Contrary, a detail which does matter is the pair bits i'm using. For 10000 objects that's >3MB of memory, so quite a lot, hard to cache.
I've tried 3 options:
Check the flag early, to spare collision math. Set it only on collision.
Check for collision first, deal with the flag only if so.
Check the flag early, set it, and then check for actual collision.

The options have shown a difference. But it was small, so i remained unsure, because i could not switch at runtime, and after a recompile things are always a bit different.
In such cases, i make a decision out of conviction on what feels right the most, which was the 3rd option. The measurements seemingly preferred option one, but i decided otherwise.

Now i just believe that the difference from those flags is bigger than the one from listptr in its own vector vs. in the object struct.
But what i try to say is: The profiler is a tool to provide help on decision making, but not a dictator. If the difference isn't big, then i do what i want.
I mean, i do not even know how other HW would react to such changes. But i do know which choices are easier to maintain, might be more flexible, general and future proof, etc. That's important too.
In this case it's just that i want to keep the code simple for my little applet to compare how different algorithms perform.
In your case, likely it won't matter for performance either, so just do what you like better?

I see yourself being tempted by nerdy micro and premature optimizations a bit here. ; )

Juliean said:
“debug performance is important, especially for game-developers”.

Maybe i'm just envious : )
But no: Debug perf. is nice to have and thus important. But profiling in debug mode is totally pointless and a waste of time.

JoeJ said:
So i go through all those 30k lines, and click to make each - a nice, collapsed +

Try to press: Ctrl + M, Ctrl + O

It should collapse everything.

JoeJ said:
But no: Debug perf. is nice to have and thus important. But profiling in debug mode is totally pointless and a waste of time.

How is it a waste of time? If I work mainly of debug, and things get to slow, I have to profile, or at least measure that. Why is this any different than release? Running those playmode-test, as a repeat example, obviously is a main bottleneck in debug. So, if I somehow managed to get the performance down by, say, like x10, then that would be way better than any release/runtime-improvements I could make. Similarily, if you managed to cut down the 2 minutes of load-time for your meshes to a value in the range to maybe 2-3x of what release has, that would also be great. And how do you know those values? Well, you measure. And if something is too slow and you have no idea? You profile. You ofc shouldn't conflate the values => faster in debug doesn't mean faster in release, sometimes it could even have adverse effects. But waste of time? Like so much, depends on application, but not in general sense, no.

JoeJ said:
I see yourself being tempted by nerdy micro and premature optimizations a bit here. ; )

Well, I originally didn't want to optimize any such case here, but now you got me hooked :P

JoeJ said:
Why do you assume 30-50%? If this were the case, the vectors of copies would win over the list, but they don't?

I'm just taking the numbers from your results. I'm talking strictly iteration performance, btw. Obviously you save much of the time on creation of the structure, but the actual numbers of time spent iterating from your figures was higher for list, IIRC, by a value of 9ns to 14ns, along those lines. And my own results did confirm that, pretty much BTW. The latest post for me clearly outlines (or at least collaborates) pretty much both our points: Lists are horribly slow to iterate, when we get into very large numbers of objects (which was my original point). Lists are slower even with lower numbers, but they could still be used to your advantange, if building the vectors really is the main bottleneck (which is part of your point).

JoeJ said:
Switching to Clang is easy now and low effort. I feel it's also especially stronger with modern language features like lambdas and templates. But you will still use Microsofts STL implementation. So if that's bad, it remains bad. Depends on compiler still ofc., but idk if we have a practical opportunity to try alternatives, running Windows. I did not search for related comparisons on the web either. Overall i'm happy, beside the debug perf. I wonder if EAs partial port of STL for games is till widely used. And why, if so.

I really do have to try that with Visual Studio, and see how the overall experience is. Unfortunately I have now commited to a few c++23-features which are not available yet in clang (which is really not the norm, usually). I could maybe change them, but eh… though, since the latest MSVC-preview already doesn't seem to compile again (yaaay), maybe in the future I'll once again eigther have to figure out some stupid compiler-bug, form a report that doesn't get answered for a year, or just upgrade.

Juliean said:
How is it a waste of time? If I work mainly of debug, and things get to slow, I have to profile, or at least measure that. Why is this any different than release?

Ok, if you optimize just for your personal use, which has to be debug mode, then why not. I thought you would optimize debug perf. assuming release mode benefits too.

Juliean said:
if you managed to cut down the 2 minutes of load-time for your meshes to a value in the range to maybe 2-3x of what release has, that would also be great.

Tbh, i do not even know if it's the loading of meshes. Could be some other loading stuff as well. But i guess it's some loading. Anyway, it's hopeless i think.
Before using STL, i did everything in debug mode. But now? No chance. Problem is, bugs only appear if i do big workloads. So even for small test scenes i use to test stuff, it's already a GB of storage to load.
It can take hours just to narrow a bug down, so i have at least a guess at which processing stage the origin of bad data happens. Very tedious.

To do the actual debugging, i use the release build but disable optimizations for a certain code file. It's slower, but ok. And debugging is a bit limited, but most things work.

Juliean said:
I'm just taking the numbers from your results.

You might interpret them wrong. The list approach is the fastest. Although that's combined build and collision detection.
Maybe, initially with the bug, the detection was slightly faster with vector per cell than with list, but that was single digit percentages. Nowhere near 30-50 %.

I run it again, looking only at collision detection timings, trying to smooth out noise, but no: Both the list and vectors of copies seem equally fast to me. Although the list needs to iterate ≤4 cells so has more logic.
Vectors of pointers is clearly slower for the collision detection. Which is counter intuitive, because it was faster before fixing the bug, eventually. But never much.

value of 9ns to 14ns

Yeah, but screenshots are random samples out of noise. Only the graph is reliable, which takes the minimum out of 10000/200 = 50 samples per histogram bucket. And even that is reliable only with higher counts, so ns become ms.

It's better you take the data from high counts and divide it by some constant, plus observing the shape of the graph. Unfortunately my applet does not really give proper data for < 100 objects.

Juliean said:
Lists are horribly slow to iterate

std::list is, but linked lists in general are not horrible, just worse then sequential arrays.

I made a new image, showing the range of 0-1200 objects magnified:

Purple line is always the lowest visible.
Now i'll do another, this time excluding the grid build:

Now the list is slower, as expected. But it's peanuts.

Factoring in the cost of nested vectors, or even making copies of objects, the list wins.

So it's not a question of what's faster to iterate or why. It only is a question of if you want your objects in such vectors per cell for other reasons too.
You do what you like, and it's good. This is what the data says, because for performance it won't matter enough to affect the decision.

If you insist on a prejudge against linked lists as a useful algorithm and data structure, just because std::list sucks, you must be cured. Weil's einfach totaler Bloedsinn ist, Mensch! ; )

Juliean said:
I have now commited to a few c++23-features

Yeah, does not show up for me. But neither does it for MSVC.
Maybe i'm out of date?

Maybe the fixed -+-+-+-+-+ already, and i just don't know???? /:O\
But no. Can't be. They'll never do…

Juliean said:
Well, I originally didn't want to optimize any such case here, but now you got me hooked :P

I got you hooked after you add acceleration sructure. :D Can be slower, but just because it's cool!

Ivica Kolic said:
Try to press: Ctrl + M, Ctrl + O It should collapse everything.

I know this, but it's somehow the opposite of what i want. It opens structs and classes open, but closes comments inside my functions.
So i try that sometimes, but then i have to go back to doing it manually.

But thanks! : )

JoeJ said:
Ok, if you optimize just for your personal use, which has to be debug mode, then why not. I thought you would optimize debug perf. assuming release mode benefits too.

Sure, release getting faster is a benefit. And I do measure it as well to compare, to make sure that its not getting slower or anything. But the main benefits to be gained are mostly in debug. The hard truth for me is that (before I had those automated tests which have to run fast in release as well), the release-build of my game was fast enough so that I'd never really have to optimize anything. Even with the real shit script-backend, it still ran uncapped 3000-5000 FPS. Now optimizing something like this is also necessary if I ever do other projects, but not really at that point in time. And its not just that game being not that demanding. It had real troubles being performant whan I worked in RPG-Maker, and I was constantly limited in what I could do because things would slow down to not even being able to run the 40 FPS that shit hat. So it does also have something to do with the base engine just being performant, as well.

JoeJ said:
You might interpret them wrong. The list approach is the fastest. Although that's combined build and collision detection. Maybe, initially with the bug, the detection was slightly faster with vector per cell than with list, but that was single digit percentages. Nowhere near 30-50 %.

No, I was looking at the separated values for a reason. Even if list wins overall, if iteration itself is slower, there could be something gained by finding an alterantive approach where vector-construction doesn't take as long. Even using an external list that in my tests added a slight overhead, might shift things a bit. Though really, in your pratical example, I don't think exchanging eigther approach for the others doesn't really matter, so I personally would go for the approach where I didn't have to store the next-pointer inside the object :D

JoeJ said:
std::list is, but linked lists in general are not horrible, just worse then sequential arrays.

Not in my tests. In the third reply, I implemented exactly your structure, and it did show the same characteristics that I measured for std::list, albeit faster by a small margin comparatively. So, if you are not also measuring those slowdowns with 1000 elements that I did (which already came close to 10x for just iteration), then IDK. Or maybe its because you are still measuring overall speed, probably? I'm really only talking about iteration speed per say. Though it still kind of weirds me out that building the vectors, even with sharing the static vectors, is so slow in your case. Even looking at my numbers, building a vector of 200.000 elements took 0.00286s, which sure has been reserved and doesn't need to allocate nor copy, but by making the vector<vector<>> static the same should happen there. So perhaps there is something about std::vector being bad here as well.

JoeJ said:
So it's not a question of what's faster to iterate or why. It only is a question of if you want your objects in such vectors per cell for other reasons too. You do what you like, and it's good. This is what the data says, because for performance it won't matter enough to affect the decision.

Yeah, pretty much this, we can agree one.

JoeJ said:
If you insist on a prejudge against linked lists as a useful algorithm and data structure, just because std::list sucks, you must be cured. Weil's einfach totaler Bloedsinn ist, Mensch! ; )

Well, unless you can point out an error in my test, which shows your list performs exactly the same as std::list, I'm afraid I will resist being “cured”, because this at least showed that any difference in your example is not down to implementation of std::list. Of course, having to actually build an std::list has its own overhead which would shift the results overall, if used. So at least, doing an implicit list as part of an object via variable, is kind of a neat optimization, that I did not fully consider in my original reply. It saves you from having to maintain a container in the first place. What I had in mind was more when you were to replace a container like std::vector with std::list (assuming again that their relative implementation is not better or worse per se, as my benchmarks show), which would be a case where you would also pay the overhead of actually creating the list as well. So I do give you that.

This topic is closed to new replies.

Advertisement