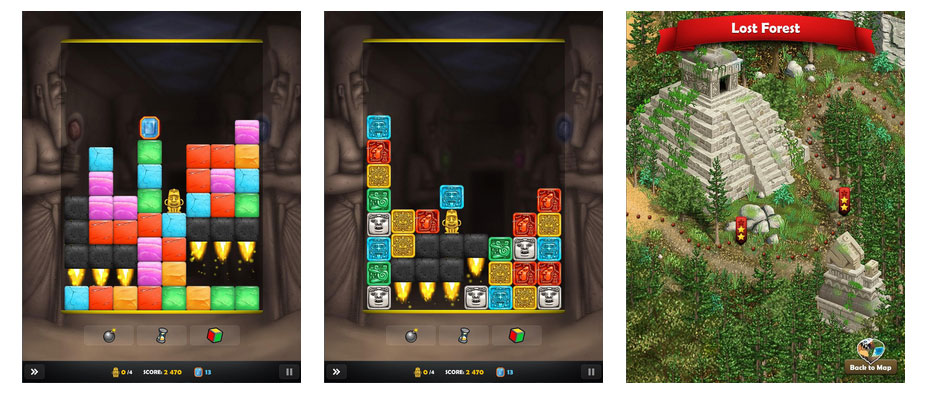
Over the next few weeks I am publishing some example analytics for optimising gameplay and customer conversion. I will be using a real world example game, "Ancient Blocks", which is actually
available on the App Store if you want to see the game in full.
The reports in this article were produced using
Calq, but you could use an alternative service or build these metrics in-house. This series is designed to be "What to measure" rather than "How to measure it".
Common KPIs
The high-level key performance indicators (KPIs) are typically similar across all mobile games, regardless of genre. Most developers will have KPIs that include:
- D1, D7, D30 retention - how often players are coming back.
- DAU, WAU, MAU - daily, weekly and monthly active users, a measurement of the active playerbase.
- User LTVs - what is the lifetime value of a player (typically measured over various cohorts, gender, location, acquiring ad campaign etc).
- DARPU - daily average revenue per user, i.e. the amount of revenue generated per active player per day.
- ARPPU - average revenue per paying user, a related measurement to LTV but it only counts the subset of users that are actually paying.
There will also be game specific KPIs. These will give insight on isolated parts of the game so that they can be improved. The ultimate goal is improving the high-level KPIs by improving as many sub-game areas as possible.
Retention
Retention is a measure of how often players are coming back to your game after a period. D1 (day 1) retention is how many players returned to play the next day, D7 means 7 days later etc. Retention is a critical indicator of how sticky your game is.
Arguably it's more important to measure retention than it is to measure revenue. If you have great retention but poor user life-time values (LTV) then you can normally refine and improve the latter. The opposite is not true. It's much harder to monetise an application with low retention rates.
A retention grid is a good way to visualize game retention over a period
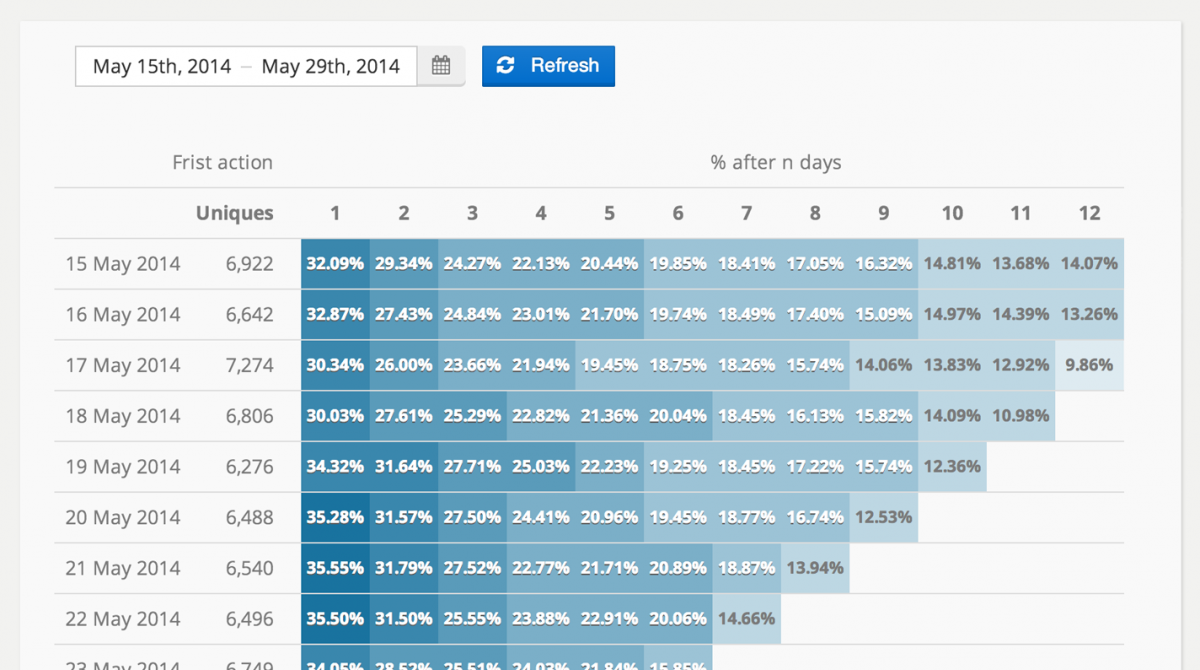
When the game is iterated upon (either by adding/removing features, or adjusting existing ones) the retention can be checked to see if the changes had a positive impact.
Active user base
You may have already head of "Daily/Weekly/Monthly" Active Users. These are industry standard measurements showing the size of your active user base. WAU for example, is a count of the unique players that have played in the last 7 days. Using DAU/WAU/MAU measurements is an easy way to spot if your audience is growing, shrinking, or flat.
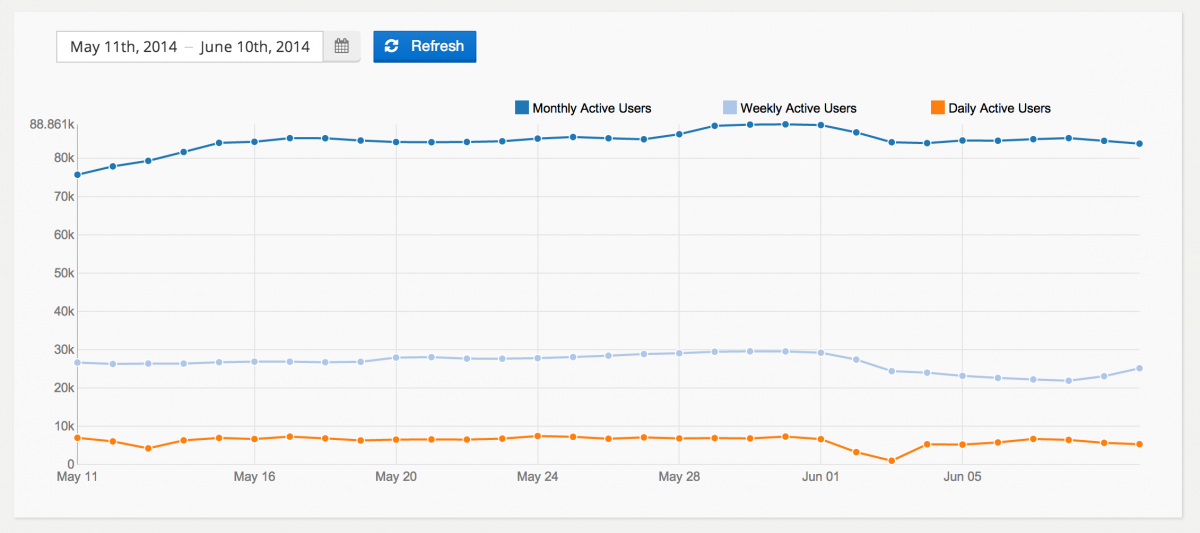
Active user measurements need to be analysed along side retention data. Your userbase could be flat if you have lots of new users but are losing existing users (known as "churn") at the same rate.
Game-specific KPIs
In addition to the common KPIs each game will have additional metrics which are specific to the product in question. This could include data on player progression through the game (such as levels), game mechanics and balance metrics, viral and sharing loops etc.
Most user journeys (paths of interaction that a user can take in your application, such as a menu to start a new game) will also be measured so they can be iterated on and optimised.
For Ancient Blocks game specific metrics include:
- Player progression:
- Which levels are being completed.
- Whether players are replaying on a harder difficulty.
- Level difficulty:
- How many attempts does it takes to finish a level.
- How much time is spent within a level.
- How many power ups does a player use before completing a level.
- In game currency:
- When does a user spend in game currency?
- What do they spend it on?
- What does a player normally do before they make a puchase?
In-game tutorial
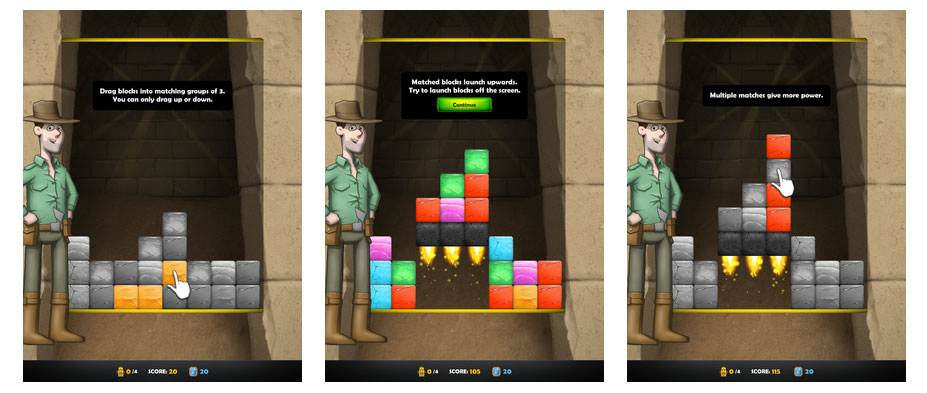
When a player starts a game for the first time, it is typical for them to be shown an interative tutorial that teaches new players how to play. This is often the first impression a user gets of your game and as a result it needs to be extremely well-refined. With a bad tutorial your D1 retention will be poor.
Ancient Blocks has a simple 10 step tutorial that shows the user how to play (by dragging blocks vertically until they are aligned).
Goals
The data collected about the tutorial needs to show any areas which could be improved. Typically these are areas where users are getting stuck, or taking too long.
- Identify any sticking points within the tutorial (points where users get stuck).
- Iteratively these tutorial steps to improve conversion rate (the percentage that get to the end successfully).
Metrics
In order to improve the tutorial a set of tutorial-specific metrics should be defined. For Ancient Blocks the key metrics we need are:
- The percentages of players that make it through each tutorial step.
- The percentage of players that actually finish the tutorial.
- The amount of time spent on each step.
- The percentage of players that go on to play the level after the tutorial.
Implementation
Tracking tutorial steps is straight-forward using an action-based analytics platform - in our case,
Calq. Ancient Blocks uses a single action called
Tutorial Step. This action includes a custom attribute called
Step to indicate which tutorial step the user is on (0 indicates the first step). We also want to track how long a user spend on each step (in seconds). To do this we also include a property called
Duration.
[table]
[tr][th]Action[/th][th]Properties[/th][/tr]
[tr][td]Tutorial Step[/td]
[td]
- Step - The current tutorial step (0 for start, 1, 2, 3 ... etc).
- Duration - The duration (in seconds) the user took to complete the step.
[/td]
[/tr][/table]
Analysis
Analysing the tutorial data is reasonably easy. Most of the metrics can be found by creating a simple conversion funnel, with one funnel step for each tutorial stage.
The completed funnel query shows the conversion rate of the entire tutorial on a step by step basis. From here it is very easy to see which steps "lose" the most users.
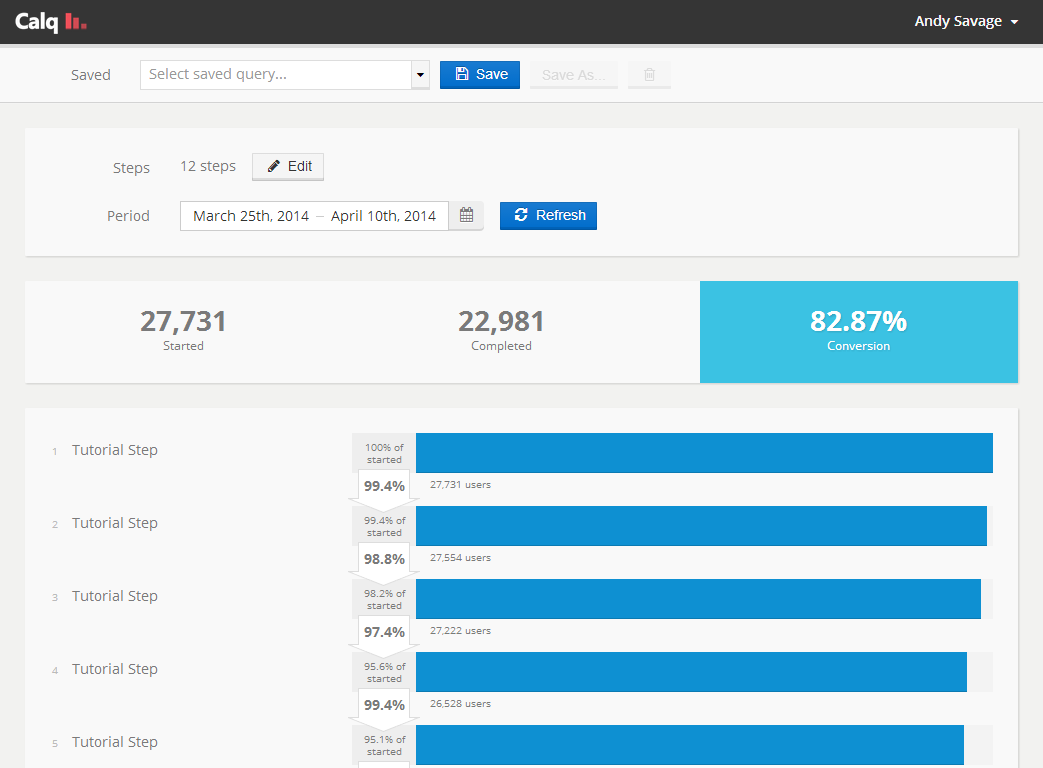
As you can see from the results: step 4 has a conversion rate of around 97% compared to 99% for the other steps. This step would be a good candidate to improve. Even though it's only a 1 percentage point difference, that still means around $1k in lost revenue just on that step. Per month! For a popular game the different would be much larger.
Part 2 continues next week, looking at metrics on game balance and player progression.


A great overview article! These kinds of measurements can benefit all kinds of games, even though they've only really been widely adopted by mobile and freemium games. And it doesn't have to be all about revenue, it can be about earnestly improving the game for everyone's benefit -- hopefully leading to happier customers, more word-of-mouth, and more downloads.
That said, its not clear what relationship you have with calq, but there appears to be one. I don't think there's anything wrong with that at all, but I (and others, I'm sure) would greatly appreciate if you disclosed the relationship and its nature.