GameDev.net gamedev.net
🔒 Locked

c++ Performance boost needed

Started by .chicken Sep 17, 2014 at 7:52 PM 34 replies 7.1k views
Original Post
.chicken
.chicken

Hello again. I'm still working on a tool for solving game theory solutions. I'm not yet happy with the performance though and since I'm kinda inexperienced, I believe there's still alot I could improve.

So basically what my program does, is

a) computing expected payouts for strategy A vs B

b) setting As strategy to maximally exploit Bs stategy

c) do the same thing for b vs a

d) repeat

I have a vector> of the size 1326*(1326/2), which save the expected win% of any hand vs any hand. The code for getting that % is:


/* equities is the vector<vector<float>> */
inline equity getEquity(startingHand hero, startingHand villain) const {
	if (hero > villain)
		return 1.0f - equities[villain][hero-villain];
	else
		return equities[hero][villain-hero];
}

My question is: is the vector slowing my program down here, compared to using a simple array? I read somewhere, that the [] operator of the vector is defined as inline, and when it's called too often (fe. inside a loop), the compiler doesn't inline it and thus the access is slowed down. Is that right? I'm calling that function from inside a 0..1326 loop.

While talking about inlines. Does it make sense to use DEFINE macros somewhere to get a speedboost?

Ok, next question. I had the following piece of code:


// kNumHands = 1326
else { // Showdown
		EV pot = currDecPt->getPlayerCIP(hero) + currDecPt->getPlayerCIP(villain);
		EV remStack = tree->getEffStack() - currDecPt->getPlayerCIP(hero);
		for (int hand = 0; hand < kNumHands; hand++) {
                        // getMostRecentRangeOf would traverse the tree upwards and find the most recent Range of villain.
                        // it returned a copy of that range though (thus copying and array of 1326floats)
			EVs[hero][iDecPt][hand] = pot*(1.0f - getMostRecentRangeOf(villain, iDecPt).getEquityVsHand(hand, currDecPt->eArray)) + remStack;
			if (finish)
				CFs[hero][iDecPt][hand] = (EVs[hero][iDecPt][hand] - remStack) / pot;
		}
	}

I changed the code to:


else { // Showdown
		const Range *r = getMostRecentRangeOf(villain, iDecPt);
		EV pot = currDecPt->getPlayerCIP(hero) + currDecPt->getPlayerCIP(villain);
		EV remStack = tree->getEffStack() - currDecPt->getPlayerCIP(hero);
		for (int hand = 0; hand < kNumHands; hand++) {
			EVs[hero][iDecPt][hand] = pot*(1.0f - r->getEquityVsHand(hand, currDecPt->eArray)) + remStack;
			if (finish)
				CFs[hero][iDecPt][hand] = (EVs[hero][iDecPt][hand] - remStack) / pot;
		}
	}

Cause I took the getMostRecentRangeOf-function out of the loop and didn't return a copy but a ptr, I expected a huge speed boost. But when running with printing the std::clock() difference, it showed no speed boost at all. Shouldn't pointers be alot quicker?

Next stop, "getEquityVsHand":


/**
* Returns the Equity of heroHand vs. villainRange on board - using an EquityArray.
*/
float Range::getEquityVsHand(startingHand villain, const EquityArray *ea) const {
	equity eq = 0.0f; frequency count = 0.0f;
	/* copy Villains Range */
        // handRange is an Array of 1326floats
	handRange temp_freqs;
	std::copy(std::begin(frequencies), std::end(frequencies), std::begin(temp_freqs));
        
        // getCardFromHand - converts the starting hand, represented as an int to two ints, representing two single cards
	card deadcards[7] = { getCardFromHand(villain, 0), getCardFromHand(villain, 1), ea->board[0], ea->board[1], ea->board[2], ea->board[3], ea->board[4] };
        // setHandsWithConflicts iterates over the handRange and deadcards.
        // If they are the same, the frequency of the hand is set to 0.
	setHandsWithConflicts(temp_freqs, deadcards, 7, 0.0f);

	for (int i = 0; i < kNumHands; i++) {
		if (temp_freqs[i] == 0.0f)
			continue;
		count += temp_freqs[i];
		eq += ea->getEquity(i, villain) * temp_freqs[i];
	}
	return eq / count;
}

So this is a little complicated. I thought copying the handRange-array would take alot of performance. So I got rid of all the copying stuff and got the following:


float Range::getEquityVsHand(startingHand villainHand, const EquityArray *ea) const {
	equity eq = 0.0f; frequency count = 0.0f;

	for (int i = 0; i < kNumHands; i++) {
		if (frequencies[i] == 0.0f 
                    || handConflictsBoard(ea->board, hand) || handConflictsHand(hand, villainHand))
			continue;
		count += frequencies[i];
		eq += ea->getEquity(i, villain) * frequencies[i];
	}
	return eq / count;
}

So, what handConflictsBoard and handConflictsHand do, is iterate over the given hands and look up if they conflict in a precomputed std::vector>. So basically the same thing that happened in "setHandsWithConflicts", I just don't have to copy the frequencies first. Now again, I expected a nice boost of performance, but instead, the performance dropped drastically and slowed down by 300%.

Since I don't wanne annoy you guys with anymore code, that's it for now. Enlighten me please, guys ;)

Thanks in advance.

Edit: Oh, I almost forgot. As I said above, I'm computing the best strategy for A, then the best response for B, again for A and so on and so forth. Shouldn't it be possible two have two threads running parallel, one starts to compute A vs B, the other one B vs A. Each one obv has to wait for the other one to finish, before continuing. Ofcourse one player would then be "one step behind", but since the solution is converging against an equilibrium, it should work anyway, right?

Shouldn't that give an immense speed boost?

alvaro
alvaro

I am not sure I am answering every question, but I'll answer a few.

vector> will require two indirections, while something[1326][1326] would only require a bit of arithmetic and one memory access. That may indeed be faster, although using twice as much memory might negate any improvement.

Macros should not provide any boost these days. Compilers are pretty good at inlining what can be beneficially inlined.

Calling getMostRecentRangeOf(villain, iDecPt)' outside the loop is the type of optimization that the compiler could be doing, if it can determine that the answer won't change. That would explain why you don't see an improvement.

In your last code transformation, you don't make a copy of the frequencies, but you also added this: "|| handConflictsBoard(ea->board, hand) || handConflictsHand(hand, villainHand)" to the loop. So you are saving some initialization time, but you are making the loop more expensive. If kNumHands' is large enough, the new code will end up being slower.

Zaoshi Kaba
Zaoshi Kaba
  1. Yes, operator[] is a little slower, especially if you have exceptions/etc turned on; it checks whether range is valid, etc. However your loop isn't big enough to make a any noticeable difference.
  2. std::clock() has horrible accuracy. Even if there is performance difference you won't notice until it's huge or it'll round wrong way giving invalid data, ex. execution time can increase by 1% by rounding will change from 16ms to 32ms. Pointers aren't "faster" or "slower", however when misused they definitely can be slower because of cache misses.
  3. I have suspicions that your handConflictsBoard() function passes values instead of references, thus copying a lot of data when it's not necessary which is likely source of your slowdown.

?If you want to make your code faster first you need to figure which part is the slowest and then see how you can improve it. Optimizing random code parts isn't likely to give significant difference.

ApochPiQ
ApochPiQ
I haven't seen the important question asked yet, so I'll be the first:

Have you profiled your program to see what the slow spots actually are?


Everything else is ritualism and voodoo until you've got hard data.
.chicken
.chicken

Yes, operator[] is a little slower, especially if you have exceptions/etc turned on; it checks whether range is valid, etc. However your loop isn't big enough to make a any noticeable difference.

Well the thing is, I'm iterating over a large tree (few hundred items) and then for each node, I loop over 1326hands. When I'm reaching a so called "Showdown"-node, I'm iterating over these hands and looking up their equity in a 1326*(1326/2)vector of floats for EVERY single of those hands. So might this add up, and using arrays is fast?


vector> will require two indirections, while something[1326][1326] would only require a bit of arithmetic and one memory access. That may indeed be faster, although using twice as much memory might negate any improvement.

I'd like to do that, but since I have to create alot of these arrays, I'll get bad_allocs too quickly. Thus, sacrificing memory and doubling the amount of data is not an option. I'd have to somehow create those arrays dynamically.


std::clock() has horrible accuracy. Even if there is performance difference you won't notice until it's huge or it'll round wrong way giving invalid data, ex. execution time can increase by 1% by rounding will change from 16ms to 32ms. Pointers aren't "faster" or "slower", however when misused they definitely can be slower because of cache misses.

What can I use to get a more precise info about my performance?


I have suspicions that your handConflictsBoard() function passes values instead of references, thus copying a lot of data when it's not necessary which is likely source of your slowdown.

I'll check that out, but all I'm passing are small arrays of integers, so copying them shouldn't be a big deal?

Have you profiled your program to see what the slow spots actually are?

As mentioned, I used std::clock() so far, and tried to find slow spots.

Thanks so far.

ApochPiQ
ApochPiQ
I'd highly suggest leaving profiling to a real tool instead of just guessing with some rough timer values. A good profiler will tell you things like the exact callstack that consumes the bulk of your time, for instance, or break down every function by its run time.

Manual code instrumentation - like you've described - is a pretty advanced technique that needs a lot of understanding of the hardware and software details before it can be employed effectively. By contrast, a good profiling tool basically highlights code and says "fix this."
.chicken
.chicken


a good profiling tool

Ok, can you recommend anything? Thank you.

_Unicron_
_Unicron_
  1. Yes, operator[] is a little slower, especially if you have exceptions/etc turned on; it checks whether range is valid, etc. However your loop isn't big enough to make a any noticeable difference

operator[] does not does not do bounds checking on a std::vector, the at(size_t) member function does do bounds checking and will throw an out_of_range exception. As for it not being inlined. As for inlining as asked by OP, this would vary from compiler to compiler. operator[] is a trivial function and I doubt the fact it is in a loop would prevent it being inlined. You would have to check the assembly code.

Also it's worth repeating what has already been said, when you are really aiming for performance gains a good profiling tool is an absolute must!

Juliean
Juliean


My question is: is the vector slowing my program down here, compared to using a simple array? I read somewhere, that the [] operator of the vector is defined as inline, and when it's called too often (fe. inside a loop), the compiler doesn't inline it and thus the access is slowed down. Is that right? I'm calling that function from inside a 0..1326 loop.

Vector is *almost* the same performance as a pure array - in release/optimized mode (debug mode at least in visual studio is horrible - vector can slow you down from 1000 to 8 FPS if you are not careful), since there happens almost no range checks, and most calls are inlined/optimized out.

I'm suprised operator[] is mentioned as being slow - actually, [] is faster than at() because [] does not perform range checks, at least for map-classes - at map, .at() will check if the index is valid, whereas [] will return a valid element eigther way, if the key didn't exist before, it will insert it. I assume it will behave similarily for vector too.

Anyways, for static arrays (int variables[256]), vector is quaranteed to be slower, since it requires at least an additional redirection. Don't use a vector here, eigther stick with pure arrays or use std::array, which is a new std container class for static arrays - vector is dynamic and therefore has certain overhead that doesn't exists for static arrays.

Madhed
Madhed


Ok, can you recommend anything? Thank you

http://www.codersnotes.com/sleepy

I don't know if it's up to "industry standards" but it is dead simple to use and gives meaningful data.

frob
frob


Ok, can you recommend anything? Thank you.

Here's a list so you don't feel I'm pressuring you into any specific product.

If you do want some direction, both AMD and Intel both have good tools that are relatively easy to use, but they also have a long list of quirks. The GNU suites can be wonderful but tend to require arcane knowledge to use well. Microsoft's performance tools are either amazing or terrible depending on your luck and skill. If you have never used a profiler before, AMD's CodeXL will probably be best.

Just about everything on that list will give you better results than your std::clock() probes.

.chicken
.chicken

http://www.codersnotes.com/sleepy


I don't know if it's up to "industry standards" but it is dead simple to use and gives meaningful data.

Ok, since this is supposed to be "dead simple" ill try and stick to that first. Thank you all so far.

Ok, this really looks kinda useful ;)

Just a quick question:

cfa385d45efaae88e6f493b798171814.png

This means, that the upper return took 2.36seconds total during the profiling? And the 1.84s are what? An average?

.chicken
.chicken

Thanks smile.png

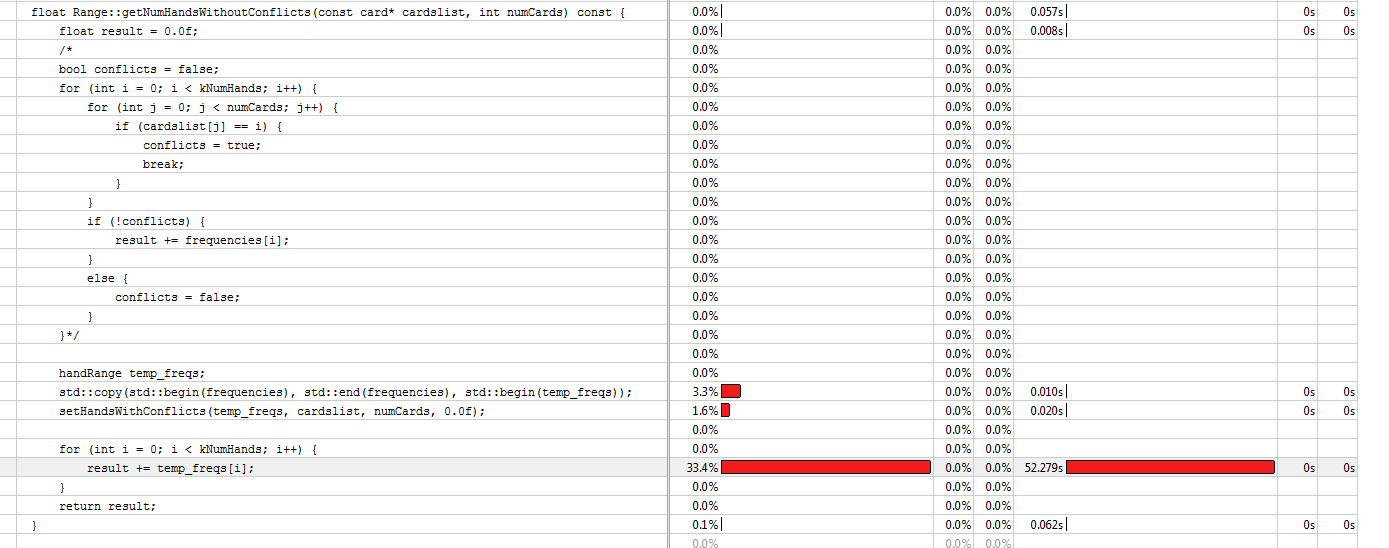
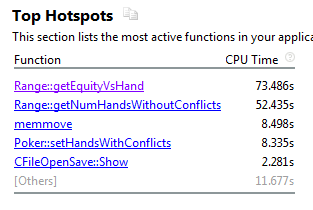
Ok, so I got the trial of the Intel VTune Amplifier now. I checked out the documentation but I don't really feel like I'm getting a better idea of where my code slows down...

09f458d8eb2435a967f566c53deb16d2.png

Why does summing up the values take so much time fe.?

So this probably means that I should somehow improve these two functions?

e716f2ef88c65d79fa804756b395ffc7.png

b846eef24452a97082ef05171a1ebb2e.png

75200b1142bad0c865dd6f8d4403c882.png

I'm not sure why this last line is so slow, either. All "getHandFromCards" does, is looking up an int in a precomputed array.

KulSeran
KulSeran


I'm not sure why this last line is so slow, either. All "getHandFromCards" does, is looking up an int in a precomputed array.

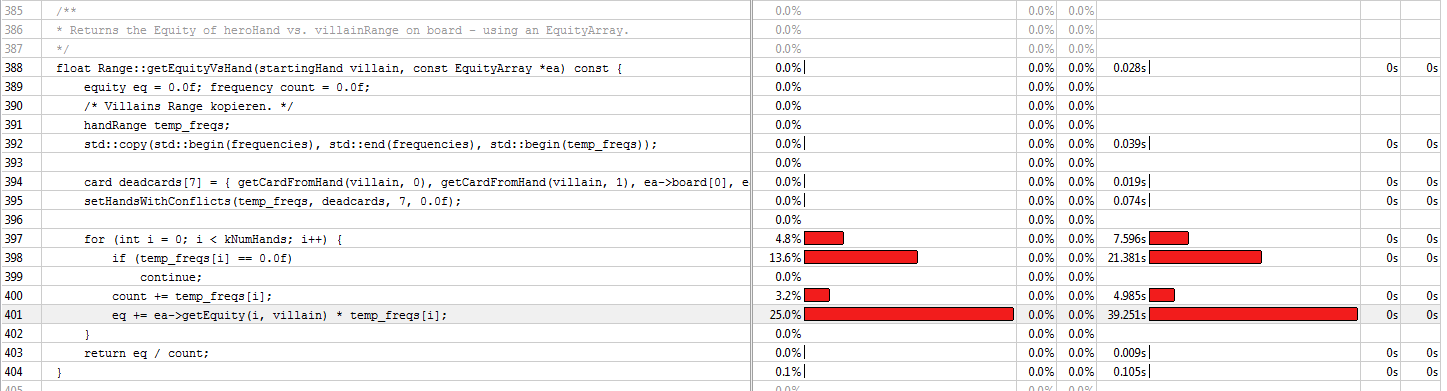
The profiler isn't just telling you things are slow. It's telling you were all the time was spent. What it is telling you is that 5% of the samples ended up on that line, and that amounted to 8s of real execution time. You have only two things to look at:

1) Why is that line getting called so much. This is the most likely problem. The objective of good optimization usually isn't fixing why lines are slow but fixing why lines are called so often. Try to pick a better algorithm or storage container for your use case and you can usually improve performance.

2) Why is this line so slow. But sometimes the line really is just slow. In this case, if it really is as simple as a lookup, the lookup table is probably too big to fit in the cache reasonably along side the rest of your data. If the profiler has a cache hit view you'd be able to see this.

frob
frob

Good to see actual numbers rather than guessing blindly.

First, is that the release build or the debug build? Profile the release build unless you have some important reason not to, such as with instrumented code where you need specific counts.

I notice each is looping over kNumHands. How big is kNumHands? Is that your roughly 900,000 size you mentioned earlier? Does it need to be that large? Looks like you are doing some brute force when smarter numeric probability algorithms may fit.

Repeating: If you can replace the algorithm with statistics rather than brute force you can reduce it from roughly a million iterations to a few computations. Even if those computations take a bit of effort to compute it is still probably faster than a million iterations. Only brute force for large numbers if you absolutely must.

For the first image, what is the code behind handRange::operator[](int) ? Is the function something trivial or something complex? Is it located in the header so it can be inlined, or located in some other compilation unit? The += is a floating point increment, so that probably isn't taking much time, unless perhaps your function is not returning a float and the result needs to be converted.

In the second image I note that the offending 25% line has got (1) a dereference or arrow operator on a class, (2) a function call with parameters, (3) an array index or operator[] on an unspecified class, (4) a multiply of unknown types possibly resulting in a class function, and (5) a += operator on a class.

Going through each...

1. Is the arrow operator the built-in operator or did the class specialize it? If specialized, make sure it is fast and placed in the header file for easy inlining.

2. Are the parameters taken as references, or are copies being made? Does the return result call a constructor or otherwise construct a temporary? Is the function fast? If it is small, is the function in the header file for easy inlining?

3. How is the array operator specialized? Make sure it is fast and placed in the header file for easy inlining.

4. Is this an integral or floating point multiply, or a custom class? It looks like it make an "equity" object rather than a built-in type. Make sure the operator is fast and in the header.

5. Make sure the += operator for the equity class is fast and in the header.

For the third image I see (1) an operator[](int) that is being assigned a value, (2) a function with two paramters, and (3) an assignment operator, inside (4) a nested loop.

1. Is the index operator fast and located in the header file? Is it returning a type that can be assigned to, rather than a temporary result?

2. Is the function call fast? Are the parameters being passed by reference or by value?

3. Is the assignment operator overridden? If so, is it fast and in the header?

4. Do you really need to do an all-pairs combination? Often it is enough to do half of all pairs rather than all pairs when (a,b) and (b,a) are equivalent.

.chicken
.chicken

Phew ok, alot to answer, I'll try my best.


The objective of good optimization usually isn't fixing why lines are slow but fixing why lines are called so often. Try to pick a better algorithm or storage container for your use case and you can usually improve performance.

I will think about that, but I'm not really sure there is another way than bruteforce. Remember, I'm trying to solve theoretical model games, and once the rules become more complex, it's almost impossible to solve the game by solving equations. Instead I'm just looking at every Decision Point with every hand (this is why the loops get so large) and try to find the best response.


the lookup table is probably too big to fit in the cache

This sounds interesting. My tables are computed like this:


/* 1326 * 1326. True if card conflicts with hand. */
	static std::vector<std::vector<bool>> fillCardConflictsHand() {
		std::vector<std::vector<bool>> result;
		for (int card = 0; card < kNumCards; card++) {
			result.push_back(std::vector<bool>());
			for (int hand = 0; hand < kNumHands; hand++) {
				if (handsToCardArray[hand].first == card || handsToCardArray[hand].second == card)
					result[card].push_back(true);
				else
					result[card].push_back(false);
			}
		}
		return result;
	}
	static std::vector<std::vector<bool>> cardConflictsHand = fillCardConflictsHand();

Then all I'm doing ist:


inline bool Poker::handConflictsCard(startingHand h, card c) {
		if (c < kNumCards)
			return cardConflictsHand[c][h];
		else
			return false;
	}

First, is that the release build or the debug build?

It's the release build.


How big is kNumHands?

kNumHands is 1326. I believe it does have to be that large, because for every hand a player CAN have, I need the frequency (float) with which he holds that hand. While we're talking about floats. I could give up a little precision and use bytes to represent a percentage from 0to100 instead, but that has nothing to do with my performance, does it?


what is the code behind handRange::operator[](int) ?

handRange is a simple typedef.


typedef int card; /* 0..51 */
	typedef int rank; /* 0..12 */
	typedef int suit; /* 0..3 */
	typedef int startingHand; /* 0..1325 */
	typedef card holdemBoard[kBoardLength]; // numerical representation
	typedef float equity;
	typedef float EV;
	typedef float frequency;
	typedef float chips;
	typedef frequency handRange[kNumHands];

Once I started the project, I felt this would give me a better idea of what I'm doing. I know regret that a little bit, but I don't think it has to do with performance?


unless perhaps your function is not returning a float and the result needs to be converted.

Thats not the case here, but do type conversion take a lot of time?


In the second image I note that the offending 25% line has got (1) a dereference or arrow operator on a class, (2) a function call with parameters, (3) an array index or operator[] on an unspecified class, (4) a multiply of unknown types possibly resulting in a class function, and (5) a += operator on a class.

The function is defined like the following:


class EquityArray {
public:
	EquityArray(holdemBoard board_);

	/**
	* Returns the equity of hero vs. villain on the equity array's board.
	* It's much faster than the the getEquityVsHand function, and should such be used whenever possible.
	*/
	inline equity getEquity(startingHand hero, startingHand villain) const {
		if (hero > villain)
			return 1.0f - equities[villain][hero-villain];
		else
			return equities[hero][villain-hero];
	}
private:
	std::vector< std::vector< equity >> equities;

The vector> here is precomputed. It gets saved locally and loaded once the Object is created (this is before all the computations are done, I'm then just passing const pointers of it). The parameters are copied, but both of them are ints, so I don't think thats a big deal?


For the third image I see (1) an operator[](int) that is being assigned a value, (2) a function with two paramters, and (3) an assignment operator, inside (4) a nested loop.

I showed you my handRange typedef. Get cardFromHands is again looking up an integer between 0..51 in a table with 1326 entries.

Thanks alot, already guys. Really appreciate you taking the time.

Edit: Just to give you a better idea. The tree I'm currently working on has ~750nodes. 10Iterations, each doing..

1) setting A's best strategy

2) setting B's best strategy

..take around 55seconds to complete.

frob
frob

Okay.

Next up, promotion from int from float can be much faster. The modern PC processor can handle potentially up to 3 floating point operations at once, but some of the execution ports can handle multiple integer operations at once, allowing the 3 ALU ports to handle up to 9 integer operations per cycle. That means not only are the operations faster, but more of them get done in parallel. If you really don't need floating point, don't use it.

For type conversion cost questions, they can take some time depending on the source and destination type. Some conversions are free since they are nothing more than syntactic sugar (converting a 32-bit value to a differently named 32-bit value), others take a tiny bit of work (float to int) and still others are potentially quite complex, such as conversions between different classes.

Let's look at these few chunks you have shown us:

// Showdown

for ( 0 .. 1326 ) {
EVs[hero][iDecPt][hand] = pot*(1.0f - getMostRecentRangeOf(villain, iDecPt).getEquityVsHand(hand, currDecPt->eArray)) + remStack;
if (finish)
CFs[hero][iDecPt][hand] = (EVs[hero][iDecPt][hand] - remStack) / pot;
}
}

getEquityVsHand(...) { // called 1326 times in your loop above

for( int i=0; i<1326; i++) {

count += array lookup // called 1.75 million times

eq += dereference, array lookup, array lookup, array lookup, float multiply, // called 1.75 million times

So that's probably on the order of 10 million cache misses each time you run your test for showdown.

From your descriptions, those functions are contained within still other loops you didn't give the code for, giving another multiple-orders-of-magnitude leap. So maybe we're looking at several hundred million or tens of billions of times through that innermost loop, we can't tell without seeing all the code.

See if you can remove some of those deeply nested loops. Any time you reach 3-deep loops -- especially non-linear memory traversal loops-- you are asking for trouble.

One way to remove that kind of deeply nested loop is to exchange time with space.

This seems like something you could precompute with a lookup table. Your "equity" system has about 2 million entries, you can build a flat array of values and look up the entry at ((villain*kNumHands)+hero). Build the array once and be done with it. No need to recompute every time.

This of course assumes you actually want your computer opponent to play perfectly. Humans prefer to win occasionally, so perfect AIs are discouraged.

KulSeran
KulSeran

std::vector<std::vector> result;
for (int card = 0; card < kNumCards; card++) {
result.push_back(std::vector());
for (int hand = 0; hand < kNumHands; hand++) {

Reserve. Reserve. Reserve. You know the sizes of your results, so reserve.


result.reserve(kNumCards);
for (int card = 0; card < kNumCards; card++) {
  result.push_back(std::vector<bool>());
  result.back().reserve(kNumHands);

This will avoid a lot of allocation/copy that is happening behind the scenes, and will help improve your write speed.

.chicken
.chicken

Ok, so I managed to improve speed ALOT thanks to some of your suggestions.

Before the program took around ~7second/iteration, now it takes around 2 and the higher the iteration becomes, the less time it takes, so that for 200iterations it just needed ~200seconds.

I did the following:

My EquityArrays hold the equity of any given hand vs any other given hand on a specific board. What took alot of time were cardremoval effects, so now, in addition to the equities, the EArrays also hold vectors with all hands that conflict with the board and all hands that dont.

So when checking for cardremoval, I can now just iterate over the set of cards that are possible on given board. (hope this makes sense)

In addition to that, in my Range class, which holds frequencies for every single poker starting hand, I know keep track of the total sum of all frequencies. Now when I want to know the sum of hands that dont conflict with the board, instead of iterating over all 1326 starting hands, combined with the new EArray functionality, I just have to iterate over conflicting hands and substract them from the stored total sum of all frequencies. (hope this makes sense as well, a bit tough to explain without going into too much detail)

Last but not least, I give up a little precision on my equity calculations. The function getEquityVsHand iterated over all hands in a Range(1326), added up their equities and averaged them. Now I'm discarding all hands which are in the range with a frequency <1% and that way I can skip alot of the loops (especially in later iterations, when most of the frequencies have either converged against a very high or a very low value).

What still interests me is if I might be possible to get additional speed by removing floats. I DO need them, but only for displaying relevant information later, so then I could just convert the integers (or bytes? which is better?) back to floats. Do you think this will have a significant impact on the overall speed?

Thank you so much already!

Topic Locked

This topic has been locked by a moderator. New replies are not allowed.

Sign in to reply to this topic.