I had the need for this a long time ago when I started to wrote my custom engine (which now has become a team project). I'm used to work with Unity's profiler as well as the Playstation 4 SDK so my requirements to a profiling solution has been based on those.
You should first understand that involving a profiler will slow-down your code and so the first and foremost feature a profiler needs to offer is to opt-in/opt-out in a way that will not impact your performance too much, especially if you don't need it. I don't know about those libraries you mentioned but having a look at it for this cirteria may help you to decide to use them or make your own built-in profiler.
Spoiler: I however wrote my own.
I have two profiler systems which may be opt-in into the build by setting a compiler flag. My LiveProfiler can be toggeled at runtime (and may have a slight performance impact) while the StaticProfiler is always on. Those systems each define a macro if enabled which are
FRM_BEGIN_PROFILE(Severity, VerbosityMask, NameTag)
to enter a profiling frame and
FRM_END_PROFILE(Severity, VerbosityMask, NameTag)
to exit the frame. Those macros redirect to the coresponding profiler function
void SetMarker(VerbosityFlags::TYPE verbosity, const byte* extra, uint8 extraSize, const char* tag = 0)
and it's overrides. An override for example is an inline function which involves a severity evaluator but I'll explain that later.
template<typename SeverityEvaluator> inline void SetMarker(VerbosityFlags::TYPE verbosity, const byte* extra, uint8 extraSize, const char* tag = 0)
{
    if (SeverityEvaluator::Process())
        SetMarker(verbosity, extra, extraSize, tag);
}
Markers work like this: I'm setting a marker for example at the beginning of a function I want to profile. The marker will have the verbosity flag set to VerbosityFlags::Start to indicate the beginning of a block. I also may add some extra data, for example a function pointer to be written into the data stream. If I leave the function or the desired profiling part, I set a new marker with VerbosityFlags::End and the same data.
The verbosity flag can also be used to filter the profiling data, for example when a team works on the project, the verbosity may reflect different team members and the team member may turn off profiling display from other team members. This is however different from the severity flag, which is the profiling level.
The overall interface is quite simple, regardless of which profiler you use.
namespace Profiler
{
    typedef FRM_CALLBACK<void (ProfilerData&)> ProfileToDeviceCallback;

    /**
     Callback that outputs certain profiling buffer to target
    */
    api void ProfileCallback(ProfileToDeviceCallback callback);

    /**
     Gets the level of severity for profiling
    */
    api uint32 Severity();

    /**
     Sets the level of severity for profiling
    */
    api void Severity(uint32 value);

    /**
     Creates a new profiling marker of given verbosity and tag
    */
    api void SetMarker(VerbosityFlags::TYPE verbosity, const char* tag = 0);

    /**
     Creates a new profiling marker of given verbosity, tag and extra data
    */
    api void SetMarker(VerbosityFlags::TYPE verbosity, const byte* extra, uint8 extraSize, const char* tag = 0);
}
Coming to the severity, there are a couple of profiling levels which can be turned on/off in code and control the amount of output. I wrote a template meta evaluator for this in order to have the compiler optimize calls away, that hit a severity which isn't currently activated. (This however only works for the StaticProfiler)
#define Constant(V) enum { Value = (V) }; \
static inline bool Process() { return Value; }

namespace Profiler
{
    namespace SeverityFlags {
    enum TYPE
    {
        Default = 0x1,
        Deep = 0x2,
        System = 0x3
    }; }

    uint32 Severity();

    template <SeverityFlags::TYPE Flag> struct DynamicSeverityEvaluator { static inline bool Process() { return (Flag <= Profiler::Severity()); } };

    template <SeverityFlags::TYPE Flag, int Level> struct StaticSeverityEvaluator { Constant(Flag <= Level); };
    template <SeverityFlags::TYPE Flag> struct StaticSeverityEvaluator<Flag, 0> { Constant(false); };
}
And finally getting data out of the engine into a nice looking UI or log file: I spawn a worker (e.g. a task in our task system) which populates the profiling data to the destination target. In order to store data packages, there needs to be some sort of buffer allocated first.
ProfilerBuffer buffers[PROFILER_MAX_THREADS];
The buffer is a round robin queue of certain size to not need to allocate something when profiling. Those buffer(s) are defined in static memory for the number of threads which should be profiled. For example if we're running a build which limits the number of thread-pool threads (task worker threads) to 32, I'm allocating 34 buffers (in order to have some extra space left). The profiling data is quiet small except you also want to have a stack trace added. Since every thread is calling the same method and we don't want the profiler to block (and impact the game too much), it is mapping the thread ID to the right buffer index and accesses the data in a lock-free fashion.
const uint32 threadId = Async::GetThreadLocalId();
ProfilerBuffer& buffer = buffers[threadId];

#if defined(PROFILER_WAIT_ON_OVERFLOW) && PROFILER_WAIT_ON_OVERFLOW == 1
while(!buffer.CanWrite(1));
#else
if(!buffer.CanWrite(1))
    return;
#endif

ProfilerData& data = *(buffer.Buffer() + buffer.WritePointer());
data.Timestamp = Atomic::Rdtsc();
data.Verbosity = static_cast<uint8>(verbosity);
data.NameTag = tag;
data.ThreadId = threadId;

#if PROFILER_STACK_SIZE > 0
const uint16 size = StackTrace(data.Trace);
if(size < PROFILER_STACK_SIZE - 1)
    data.Trace[size] = 0;
#endif

data.Extra = extra;
data.ExtraSize = extraSize;
What you can see here is some optional behavior. The thread can wait on the buffer to be flushed if there are no more slots in it or just ignore the overflow and the package is discarded. Adding the stack trace to the current function is also possible, this can help the tool you later view the data in, to differentiate better between function calls.
Everything else is straight forward. I'm using the Rdtsc CPU instruction in order to get a more reliable timing since QueryPerformanceCounter is some portions slower than Rdtsc and we want precise data. The thread ID will help to identify and display the section in the proper row in our profiling viewer.
Everything left is now to send the data to the right output channel. You may have recognized the profile callback which can be set in the profiler itself. This is a callback function which is feeded from the worker thread in order to push the data packages to the right output channels.
void Profiler::Iterate()
{
    if(callback)
    {
        for(uint8 i = 0; i < LOG_MAX_THREADS; i++)
        {
            ProfilerBuffer& buffer = buffers[i];
            if(buffer.CanRead())
            {
                callback(*(buffer.Buffer() + buffer.ReadPointer()));
                buffer.ReadPointer(1);
            }
        }
    }
    ThreadPool::Enqueue(THREADPOOL_JOBCONTEXT_TYPE<void ()>::Create<&Iterate>());
}
void Profiler::Iterate(ThreadWorker* worker)
{
    Async::SetThreadLocalId(ThreadPool::GetWorkerId(worker));
    bool loop;
    do
    {
        loop = false;
        Async::Suspend(PROFILER_MAX_THREADS);
        if(callback)
        {
            for(uint8 i = 0; i < LOG_MAX_THREADS; i++)
            {
                ProfilerBuffer& buffer = buffers[i];
                if(buffer.CanRead())
                {
                    callback(*(buffer.Buffer() + buffer.ReadPointer()));
                    buffer.ReadPointer(1);
                    loop |= buffer.CanRead();
                }
            }
        }
    }
    while(!ThreadPool::Signaled() || loop);
}
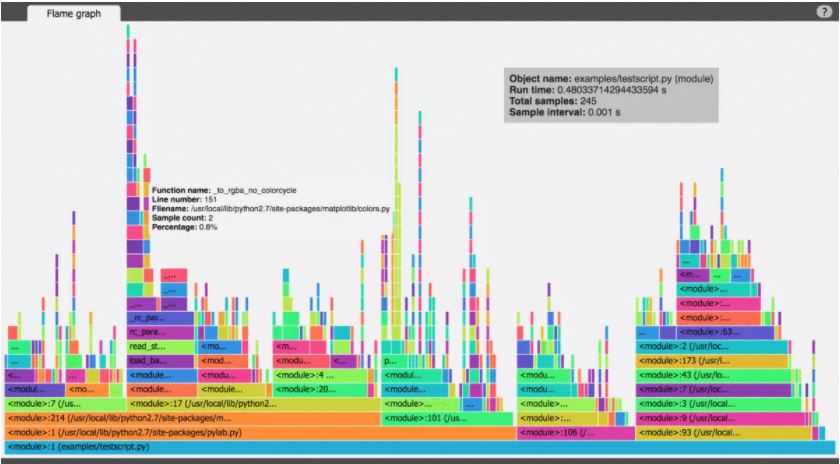
I've decided for a callback solution because what I liked to do is to send the packages via UDP to a destination machine and port. On that port our C# profiling tool was listening to the packages and displayed them in a nice graph we were able to move around and zoom in/out


